Introduction to Observability
Whether you are building a HomeLab or working for a Fortune 100 corporation, it is critical to have monitoring & reporting in place. Without monitoring, you cannot know if your infrastructure is online or how reliable & available it is.
This article will cover popular infrastructure monitoring solutions that are open-source or have a free tier available. We will go over each technology at a high level and then build a minimal instance of it for practical exposure. Future articles will expand on Docker, log aggregation, alerting, SIEM, and RMM.
System Assumptions
- Have a basic understanding of Linux
- This article was made on Ubuntu 20.04
- Have a functional Docker Engine + Compose installation
- This article was made with Docker Engine 27.x
- Have a directory to build your sub-directories for each compose file
- This article uses /docker
Technologies Covered
- Uptime Kuma
- NetAlertX
- NetData
- Grafana + Prometheus
- Icinga2
- Zabbix
- Nagios
- Munin
- Cacti
- PRTG
This article aims to provide exposure to the most common monitoring technologies. It is not a detailed review or comparison; each solution is a valid option for most use cases. SolarWinds and WhatsUpGold are not covered in this article, but if necessary, they will be included later.
Application#1 Uptime Kuma
Product Introduction
Uptime Kuma is one of the top monitoring solutions in the open-source community. It provides a simple, elegant, and scalable interface for monitoring endpoints. Native sensor types include Ping, HTTP APIs, DNS resolvers, Databases, Docker containers (if you have a socket exposed), and Steam Game Servers.
Post-instructions screenshot:
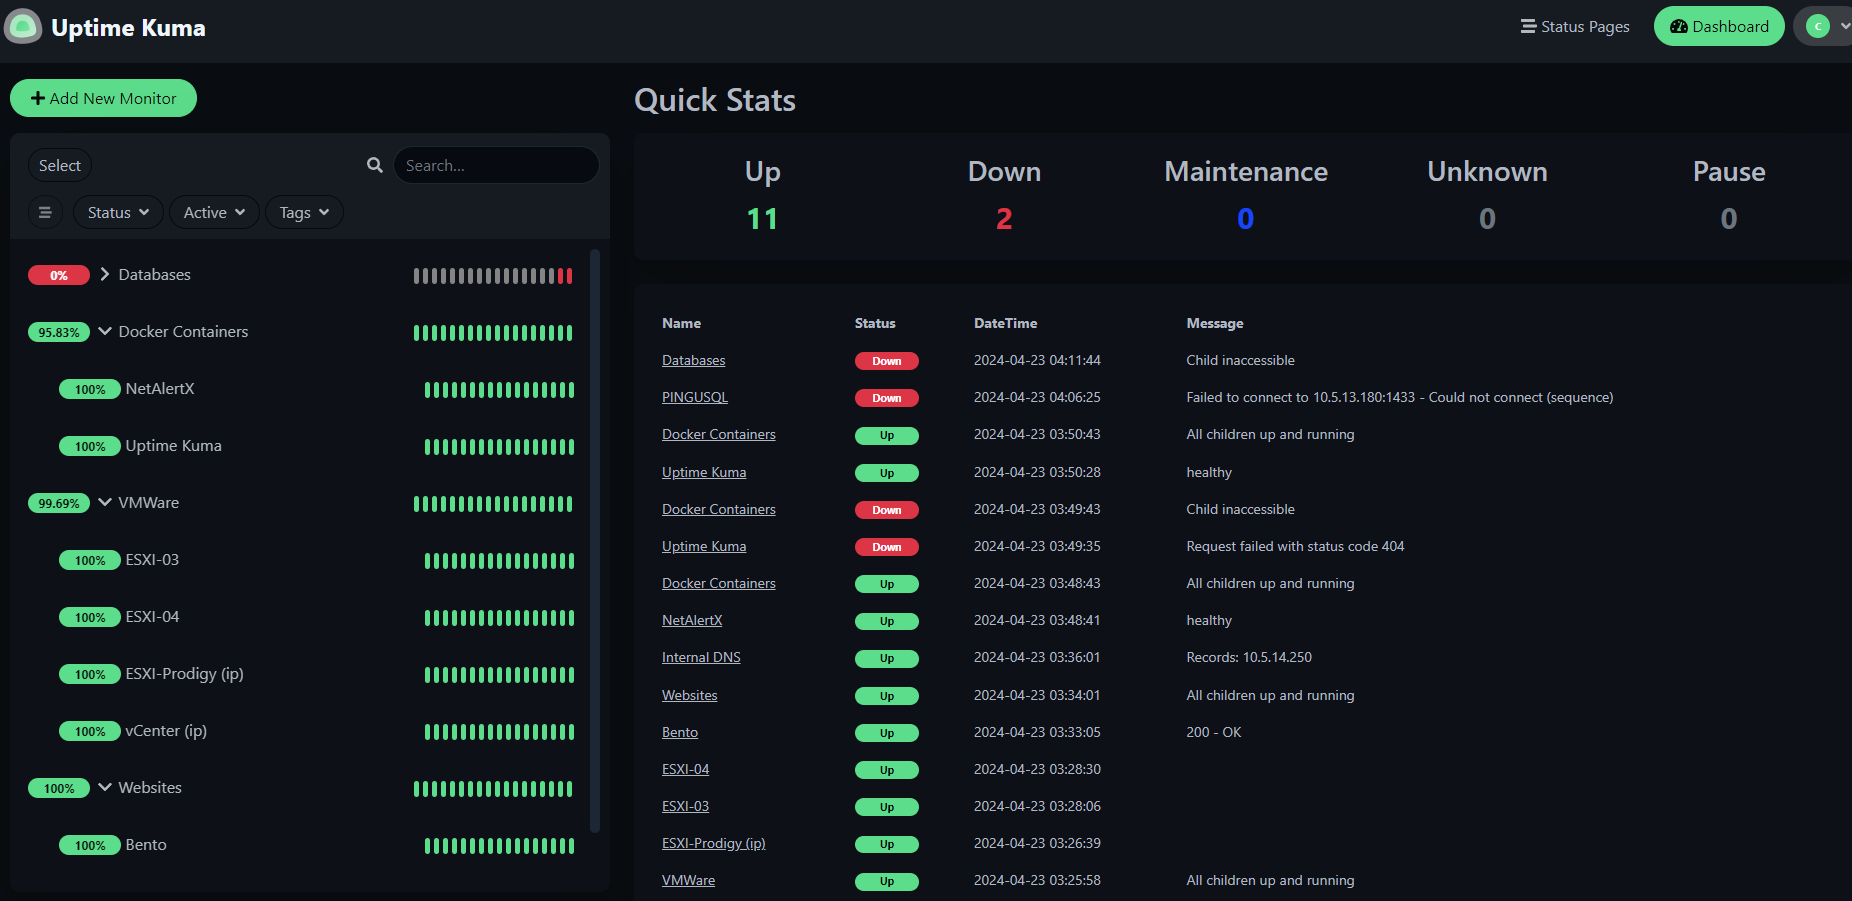
You can also build custom status pages hosted on a subdomain of the Uptime Kuma server, allowing public visibility into your chosen metrics. Uptime Kuma has built-in MFA, Proxy Support, and integrations with a handful of notification services, such as Slack, Email, Pushover, etc.
This demo is built using the official Uptime Kuma GitHub Repo.
Product Deployment
Pre-Reqs
- Create the folders for persistent volumes
sudo mkdir -p /docker/UptimeKuma/app/data
- Navigate to the root directory for the container
cd /docker/UptimeKuma
- Create the docker compose file
sudo nano docker-compose.yaml
- Paste the docker compose code below and save the document
Docker Compose
version: '3.3'

services:
  uptime-kuma:
    image: louislam/uptime-kuma:1
    container_name: uptime-kuma
    volumes:
      - /docker/UptimeKuma/app/data:/app/data
      - /var/run/docker.sock:/var/run/docker.sock
    ports:
      - 3001:3001
    restart: always
Application Config
1. Run the docker container
– sudo docker compose up -d
2. Navigate to the ip of the website on port 3001
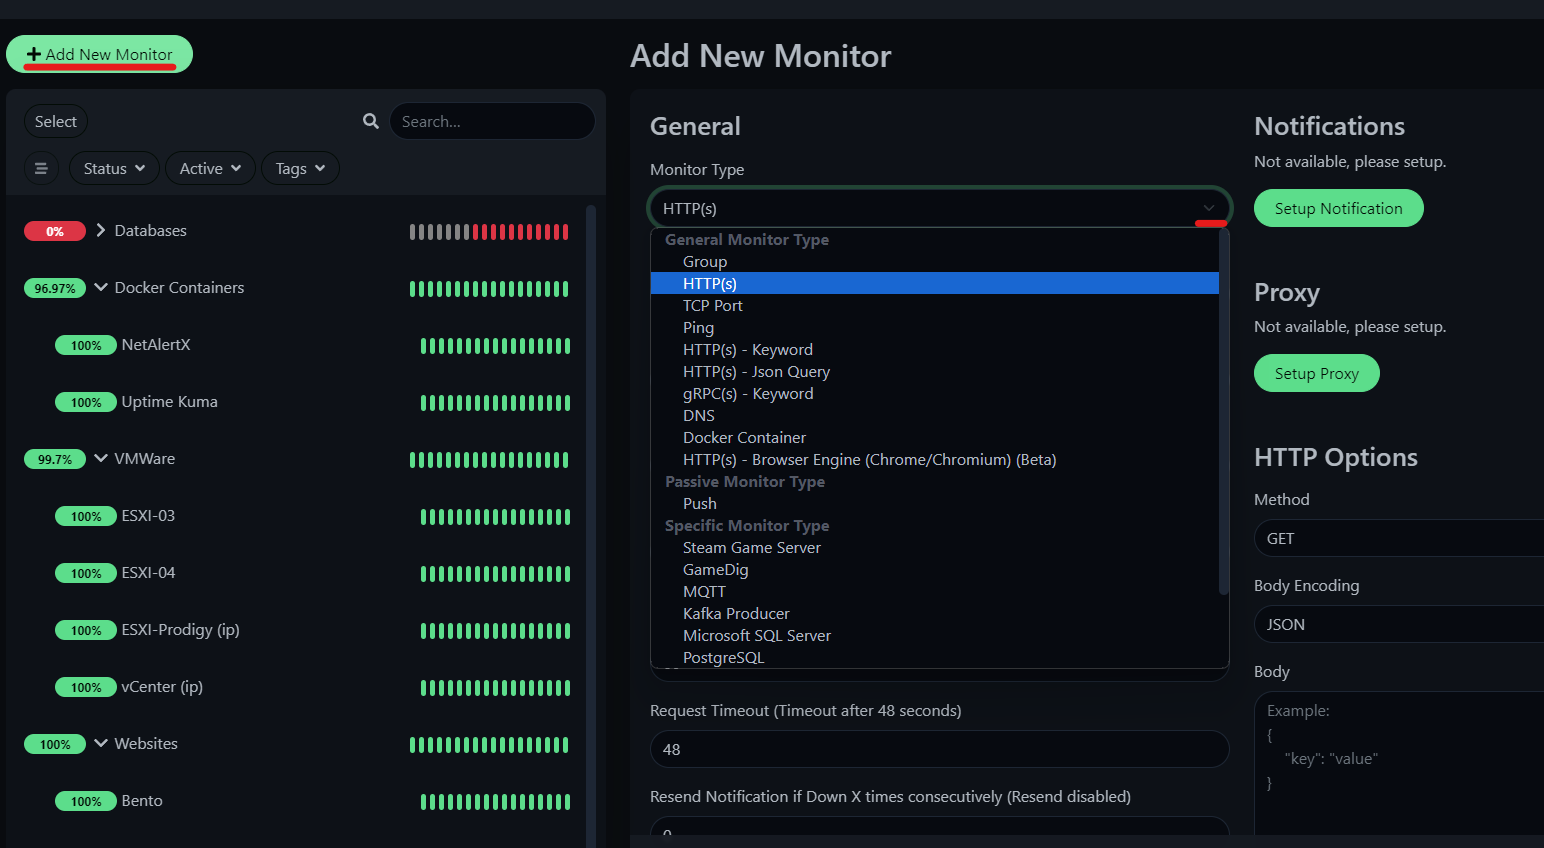
3. Click ‘Add New Monitor’ in the upper left
4. Select the appropriate sensor type from the dropdown
5. Provide the display name and hostname of the endpoint
6. Add to any organizational groups before saving
Application#2 NetAlertX
Product Introduction
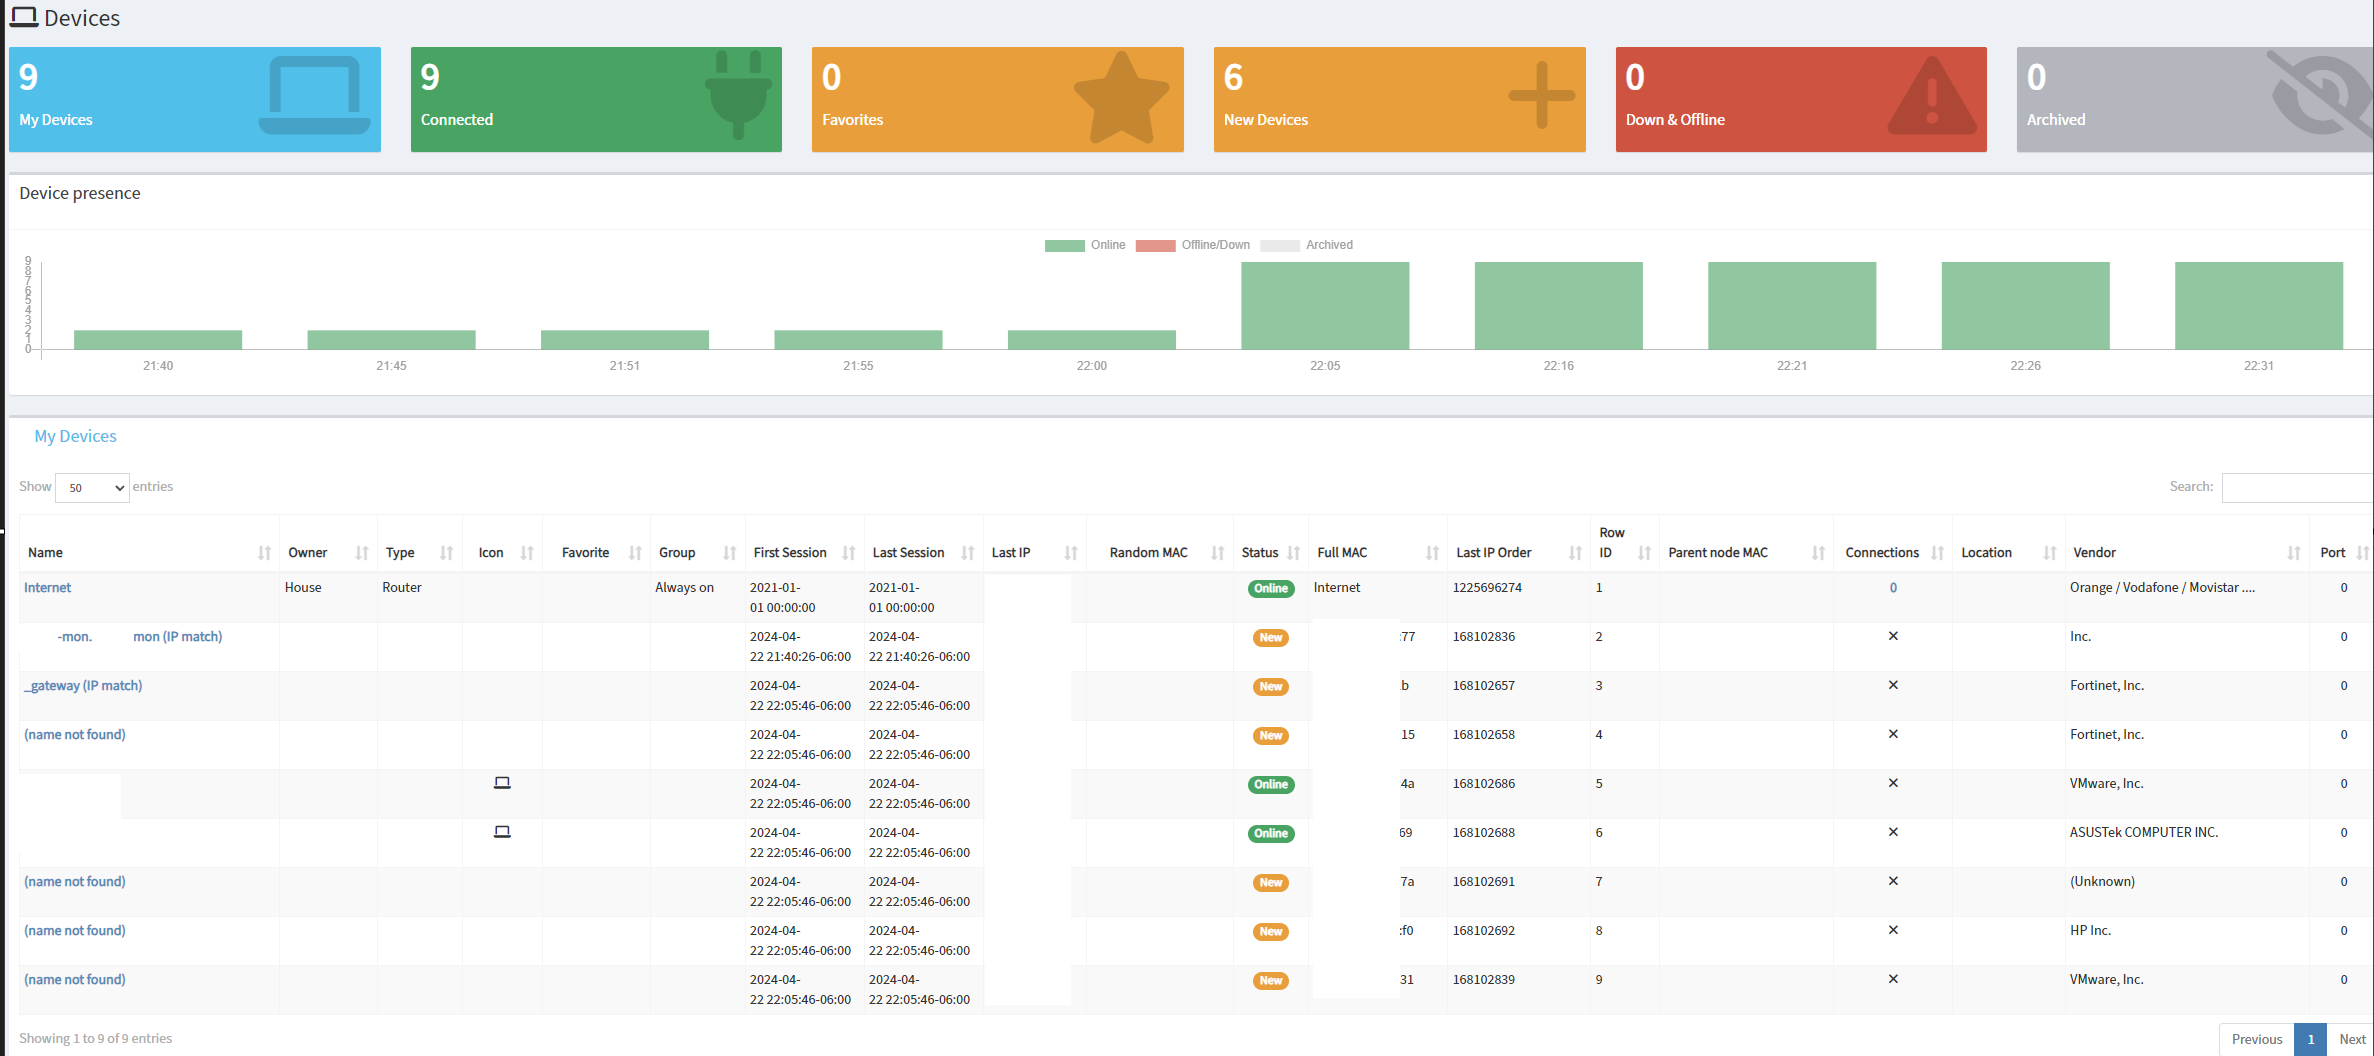
PiAlert was the best monitoring solution available for the Raspberry Pi. It has been forked a couple of times and now exists as NetAlertX. NetAlert uses arp and nmap to discover devices but it can also integrate with other devices on your network with SNMP or vendor specific integrations like Unifi or PiHole.
Post-instructions screenshot:
This demo is built using the official NetAlertX GitHub Repo.
Product Deployment
Pre-Reqs
- Create the folders for persistent volumes
sudo mkdir -p /docker/netalertx/app/config /docker/netalertx/app/db /docker/netalertx/app/front/log
- Navigate to the root directory for the container
cd /docker/netalertx
- Create the docker compose file
sudo nano docker-compose.yaml
- Paste the docker compose code below and save the document
Docker Compose
version: "3"

services:
  netalertx:
    container_name: netalertx
    image: "jokobsk/netalertx:latest"
    network_mode: "host"
    restart: unless-stopped
    volumes:
      - /docker/NetAlertX/config:/app/config
      - /docker/NetAlertX/app/db:/app/db
      - /docker/NetAlertX/app/front/log:/app/front/log
    environment:
      - TZ=America/Denver
      - PORT=20211
Application Config
- Run the docker container
sudo docker compose up -d
- Navigate to the ip of the website on port 20211
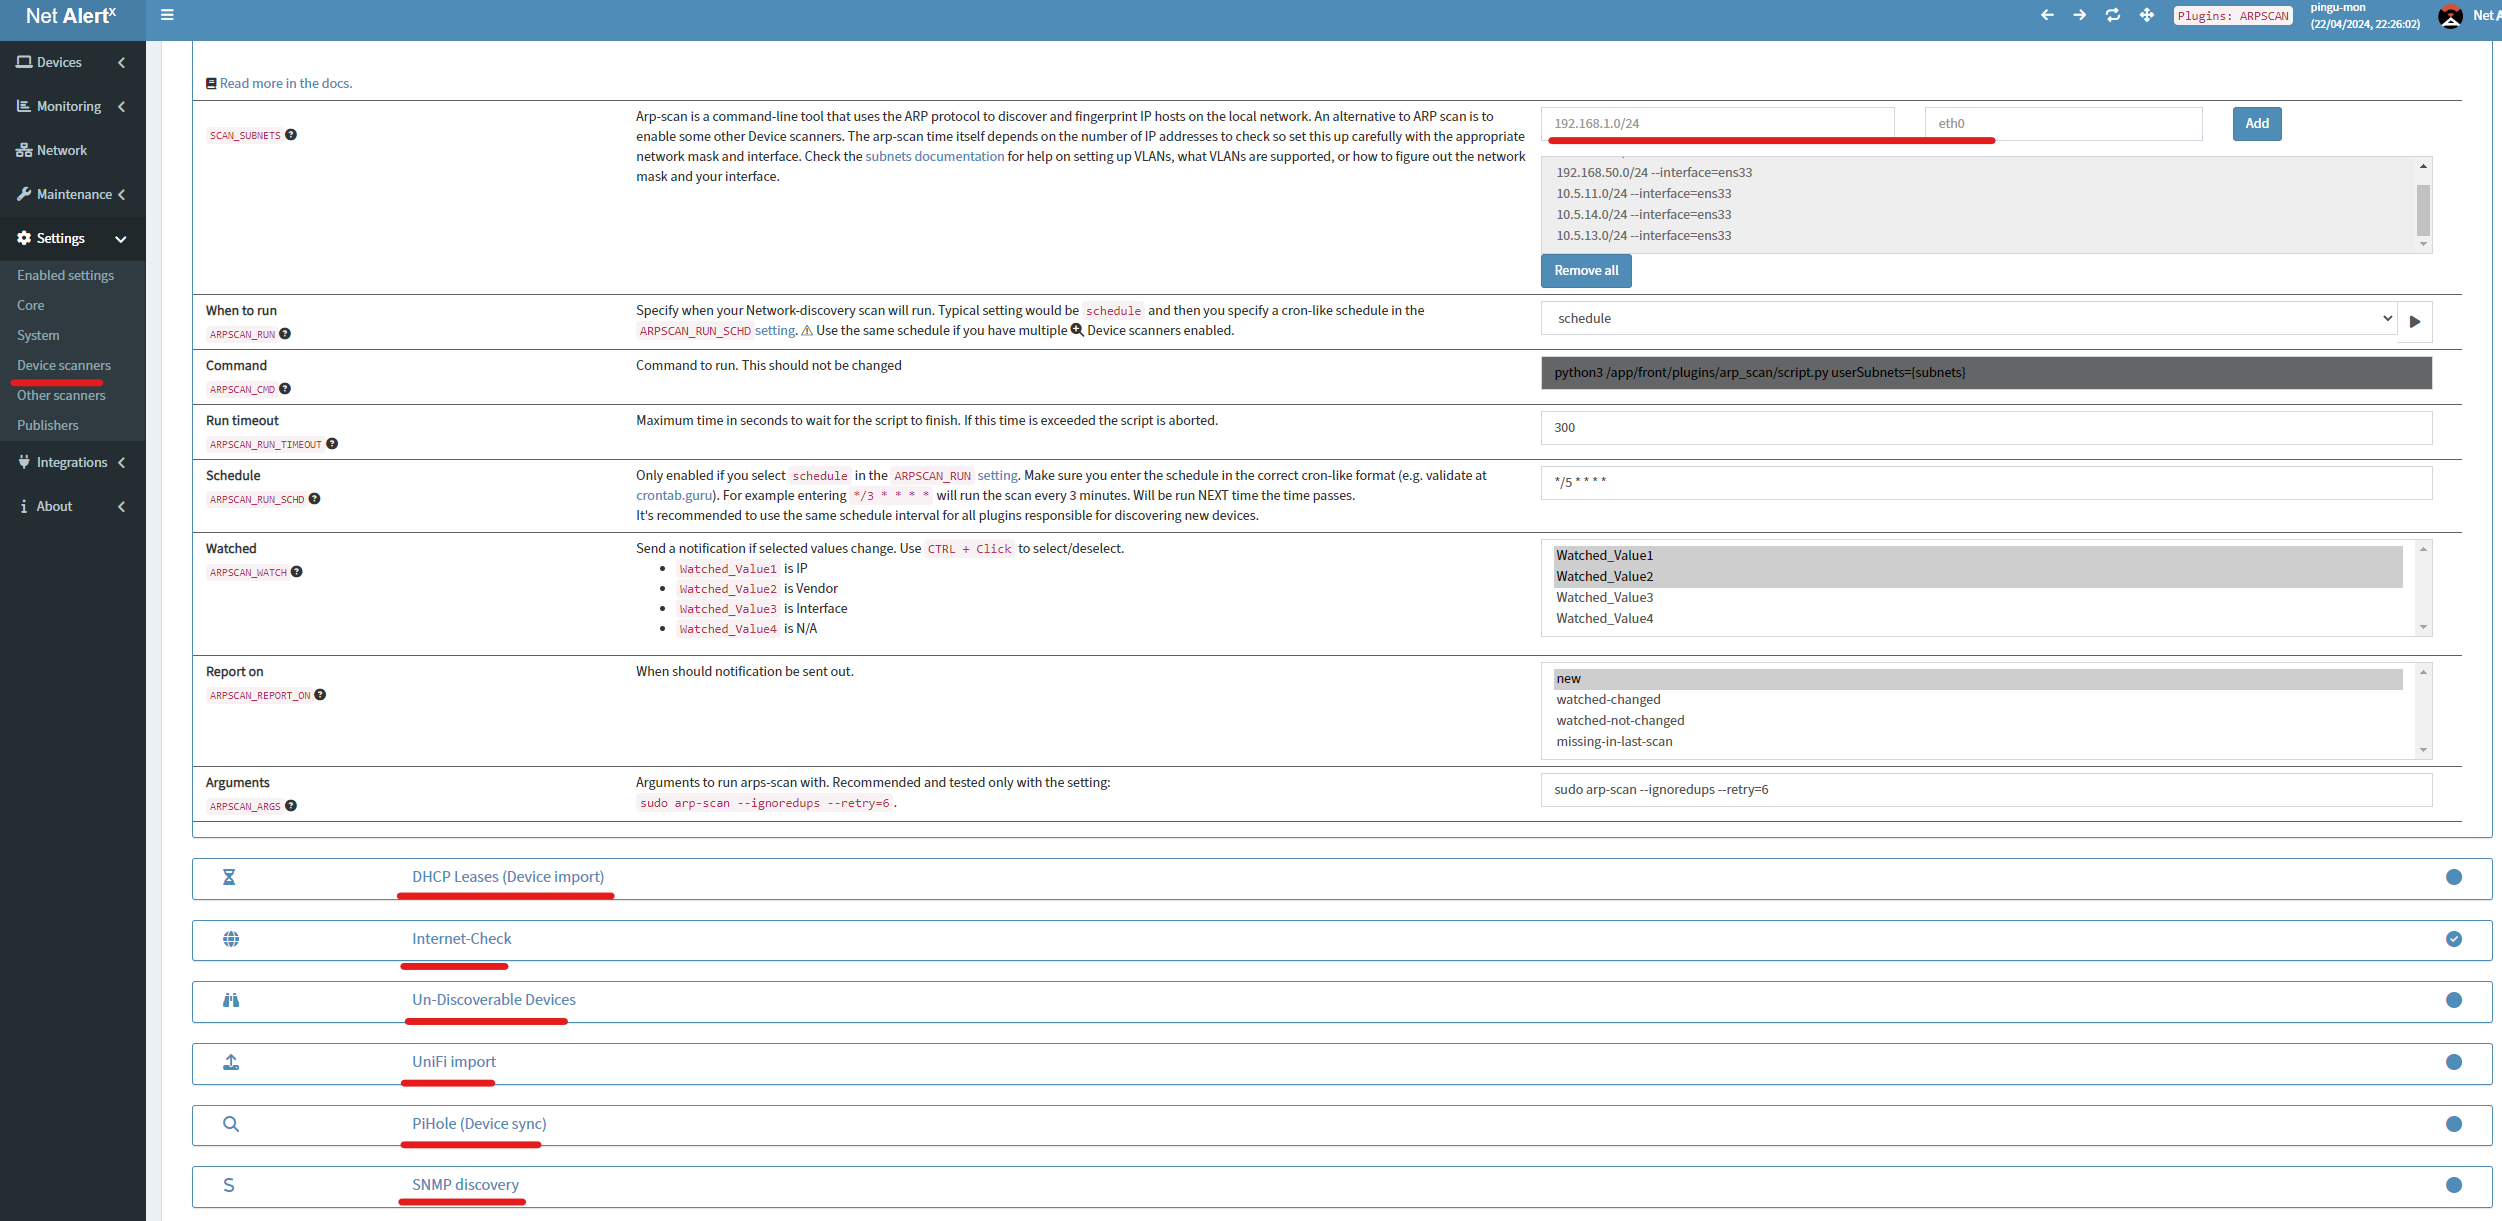
- On the left hand side open the settings menu
- Click on Device Scanners
- Set these however makes sense for your usecase
Application#3 NetData
Product Introduction
NetData touts itself as the no.1 solution because it is 50%-90% more efficient than its competitors and designed for use ‘out of the box’ with minimal configuration. The product is exceptionally feature-rich and customizable with minimal effort; it’s very impressive that it runs ML against every metric in real-time and outputs a graph of anomalies.
Post-instructions screenshot:
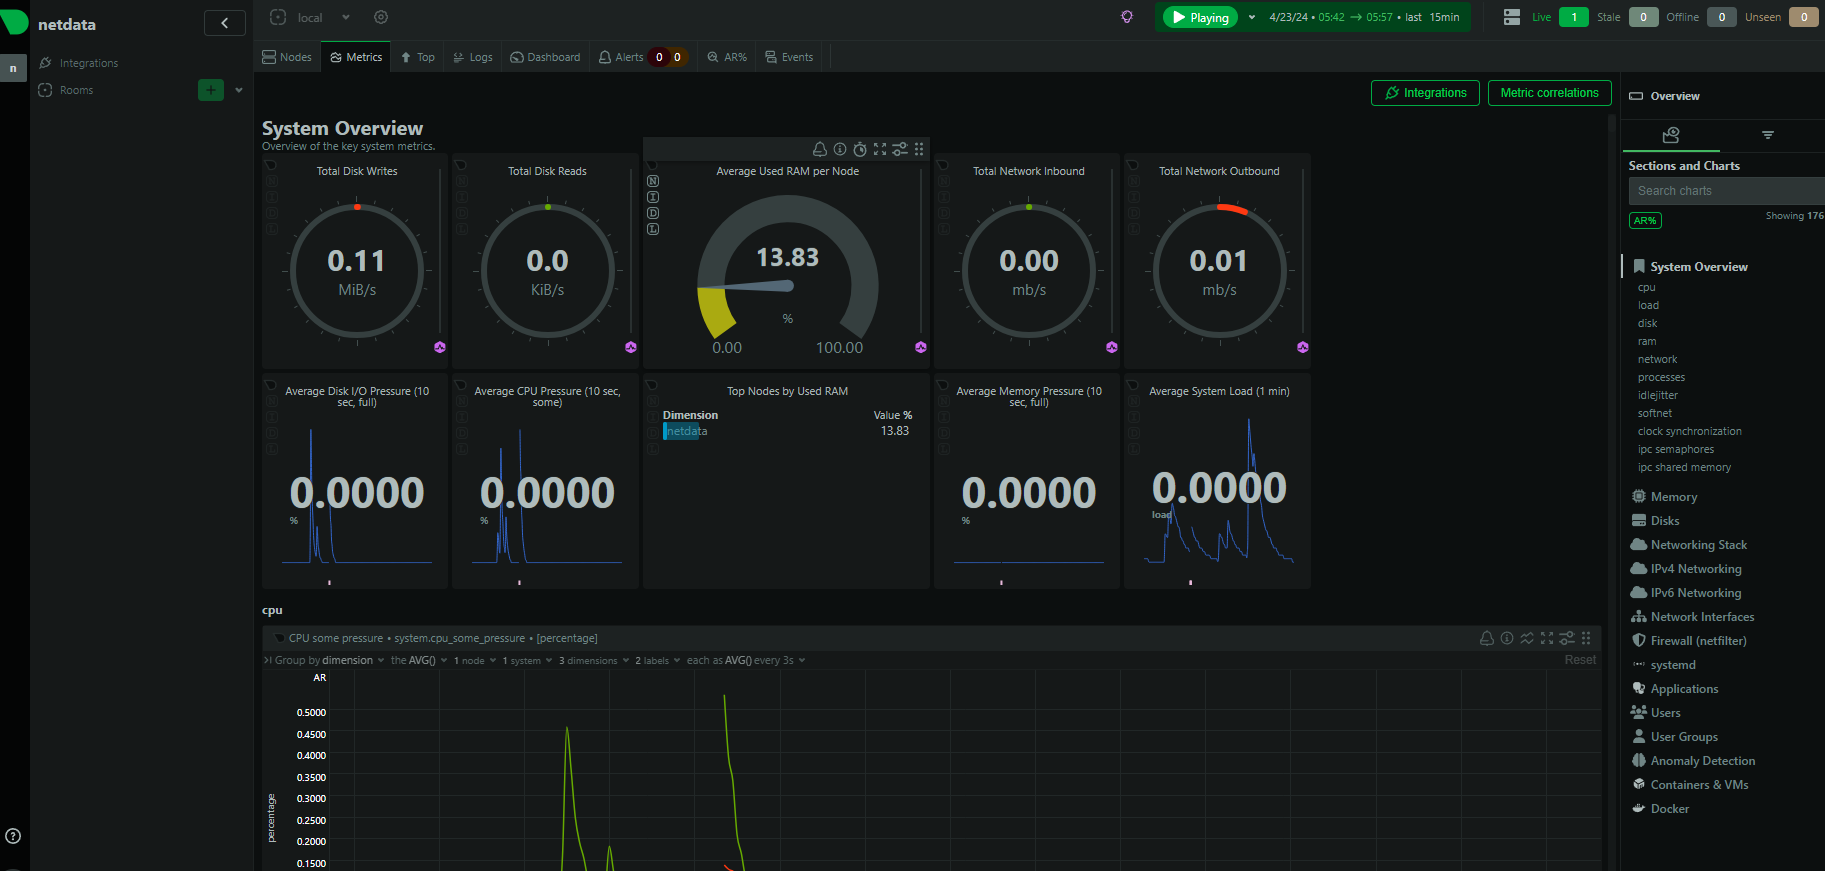
This demo is built using the official NetData GitHub Repo.
Product Deployment
Pre-Reqs
- Create the folders for persistent volumes
sudo mkdir -p /docker/NetData/etc
- Navigate to the root directory for the container
cd /docker/NetData
- Create the docker compose file
sudo nano docker-compose.yaml
- Paste the docker compose code below and save the document
Docker Compose
version: '3'
services:
  netdata:
    image: netdata/netdata
    container_name: netdata
    hostname: netdata
    pid: host
    network_mode: host
    restart: unless-stopped
    cap_add:
      - SYS_PTRACE
      - SYS_ADMIN
    security_opt:
      - apparmor:unconfined
    volumes:
      - /docker/netdata/etc:/etc/netdata
      - netdatalib:/var/lib/netdata
      - netdatacache:/var/cache/netdata
      - /etc/passwd:/host/etc/passwd:ro
      - /etc/group:/host/etc/group:ro
      - /etc/localtime:/etc/localtime:ro
      - /proc:/host/proc:ro
      - /sys:/host/sys:ro
      - /etc/os-release:/host/etc/os-release:ro
      - /var/log:/host/var/log:ro
      - /var/run/docker.sock:/var/run/docker.sock:ro

volumes:
  netdatalib:
  netdatacache:
Application Config
- Go to the NetData web interface on http port 19999
- Add integrations by clicking the green ‘integrations’ button in the upper right
- NetData built defaults for the server but from here you can setup other endpoints

Application#4 Grafana + Prometheus
Product Introduction
Grafana and Prometheus are the iconic duo of monitoring tools despite being two separate companies/products. Prometheus provides a real-time monitoring solution with a granular query language, and Grafana delivers an intuitive and versatile program to make stunning dashboards and visualize data. Grafana and Prometheus were not designed to be run in Docker and should typically be installed as system applications in a production environment unless you have strong Docker chops.
I am not a fancy dashboard guy so post-install screenshot is from the repo:
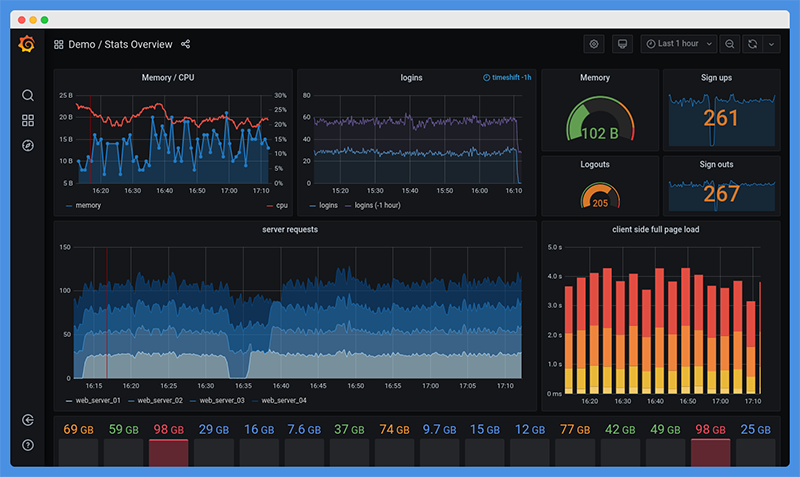
This demo is built using the official Grafana GitHub Repo, the official Prometheus GitHub Repo, and a community GitHub page.
Product Deployment
Pre-Reqs
- Create the folders for persistent volumes
sudo mkdir -p /docker/Grametheus
- Navigate to the root directory for the container
cd /docker/Grametheus
- Create the docker compose file
sudo nano docker-compose.yml
- Paste the docker compose code below and save the document
- Continue to create files provided in the headers below using their respective code
- prometheus.yml, grafana_config.ini, grafana_datasources.yml
Docker Compose
version: '3'
volumes:
  prometheus_data: {}
  grafana_data: {}
services:
  alertmanager:
    container_name: alertmanager
    hostname: alertmanager
    image: prom/alertmanager
    volumes:
      - /docker/Grametheus/alertmanager.conf:/etc/alertmanager/alertmanager.conf
    command:
      - '--config.file=/etc/alertmanager/alertmanager.conf'
    ports:
      - 9093:9093
  prometheus:
    container_name: prometheus
    hostname: prometheus
    image: prom/prometheus
    volumes:
      - /docker/Grametheus/prometheus.yml:/etc/prometheus/prometheus.yml
      - /docker/Grametheus/alert_rules.yml:/etc/prometheus/alert_rules.yml
      - prometheus_data:/prometheus
    command:
      - '--config.file=/etc/prometheus/prometheus.yml'
    links:
      - alertmanager:alertmanager
    ports:
      - 9090:9090
    extra_hosts:
      - 'promdock:host-gateway'
  grafana:
    container_name: grafana
    hostname: grafana
    image: grafana/grafana
    volumes:
      - /docker/Grametheus/grafana_datasources.yml:/etc/grafana/provisioning/datasources/all.yaml
      - /docker/Grametheus/grafana_config.ini:/etc/grafana/config.ini
      - grafana_data:/var/lib/grafana
    ports:
      - 3000:3000
You will need to make the following files in addition to the docker-compose.yaml:
prometheus.yml
global:
  scrape_interval:     15s
  evaluation_interval: 15s
alerting:
  alertmanagers:
    - static_configs:
      - targets: ["promdock:9093"]
rule_files:
  - /etc/prometheus/alert_rules.yml
scrape_configs:
  - job_name: 'vad-metrics'
    metrics_path: '/metrics'
    scrape_interval: 5s
    static_configs:
      - targets: ['docker:9090']
grafana_config.ini
[paths]
provisioning = /etc/grafana/provisioning
[server]
enable_gzip = true
grafana_datasources.yml
apiVersion: 1
datasources:
  - name: 'prometheus'
    type: 'prometheus'
    access: 'proxy'
    url: 'http://prometheus:9090'
alertmanager.conf
global:
  resolve_timeout: 5m
route:
  group_by: ['alertname', 'job']
  group_wait: 10s
  group_interval: 10s
  repeat_interval: 1h
  receiver: 'file-log'
receivers:
- name: 'file-log'
  webhook_configs:
  - url: 'http://localhost:5001/'
Application Config
-
- Create empty file for alert manager
sudo touch alertmanager_rules.yml
- Navigate to the ip of the website on port 3000 for grafana
- Login with admin/admin
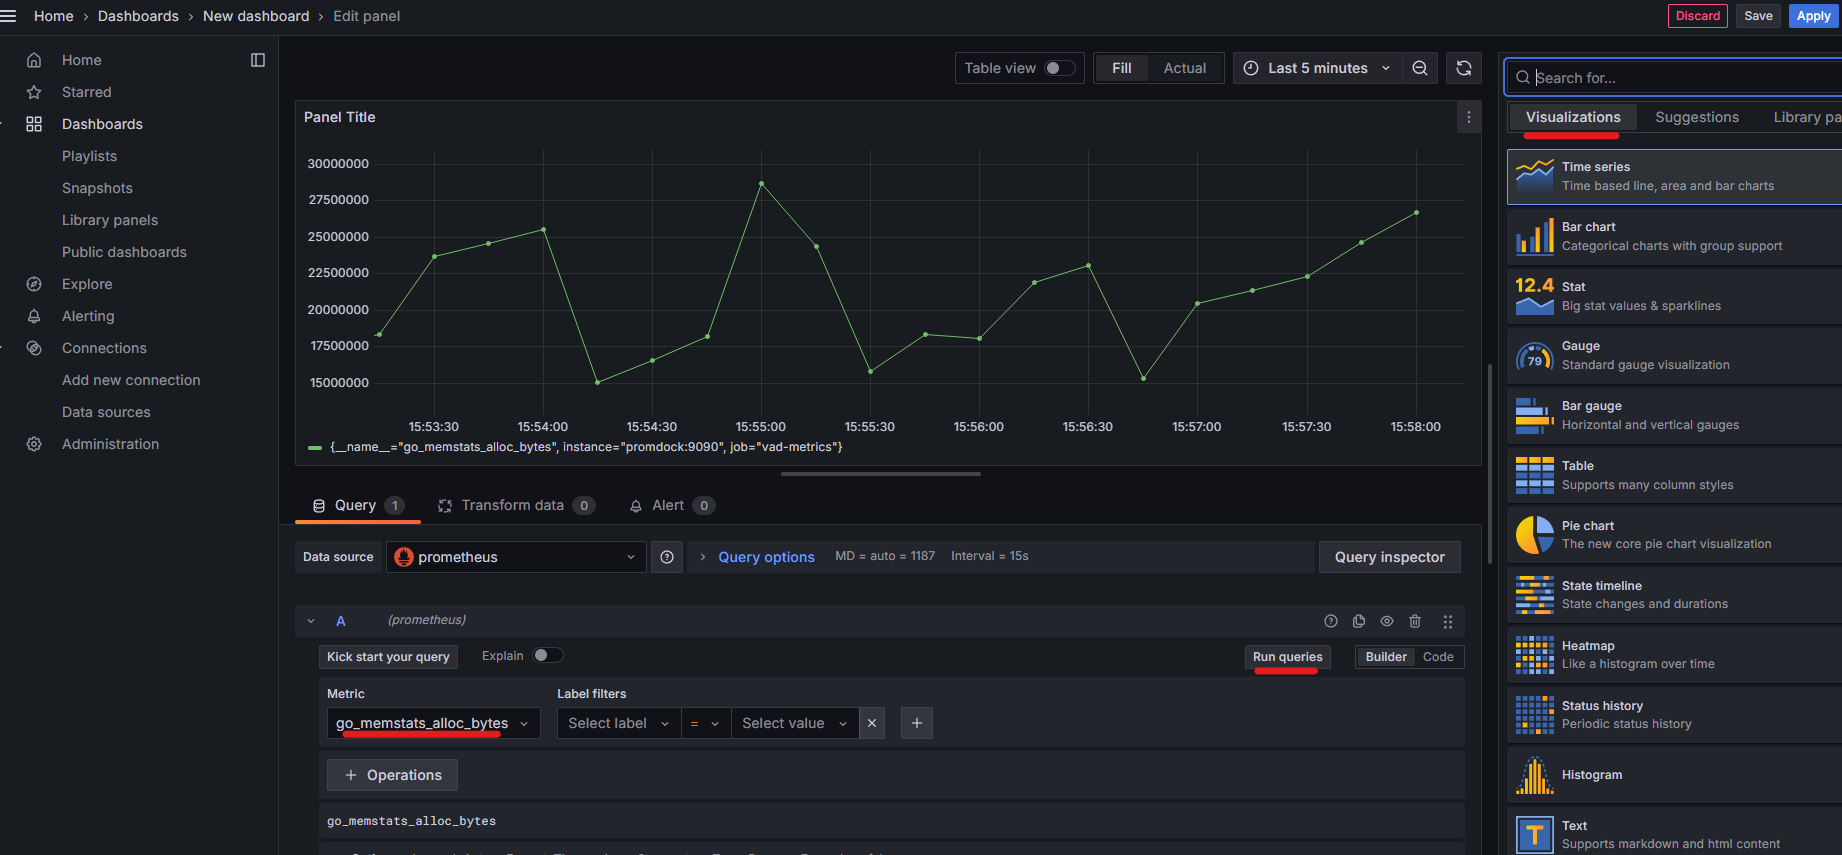
- Open the Dashboards menu on the far left navigation
- Click the blue ‘+ Create Dashboard’ button in the center of the screen
- On the following screen click the ‘+ Add Visualization’ button
- Select the ‘Prometheus’ option (should be the only option)
- Use the metric dropdown and select your desired metric
- Run the query using the ‘Run Query’ button in the middle right
- Choose what visualization you want in the upper right
- Continue creating visualizations and save the dashboard
- Create empty file for alert manager
Application#5 Icinga2
Product Introduction
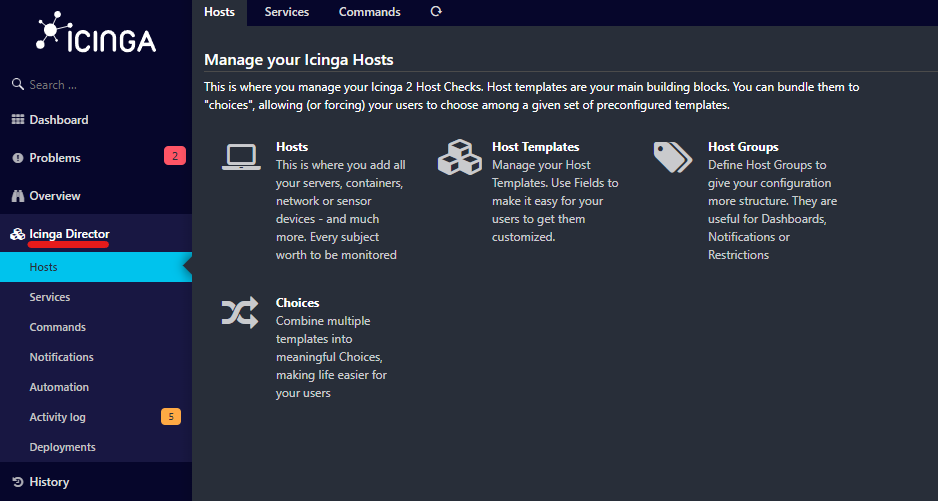
Icinga2 is the most powerful and configurable monitoring solution I have ever used. Without a PhD from Icinga University, I find it very difficult to get started with, but the potential is unlimited. Historically, a lot of C++ and programming elements were used in the management and operation of Icinga, but with the advent of their ‘Director’ solution, you are now able to do it from a web portal.
Post-Instructions Screenshot:
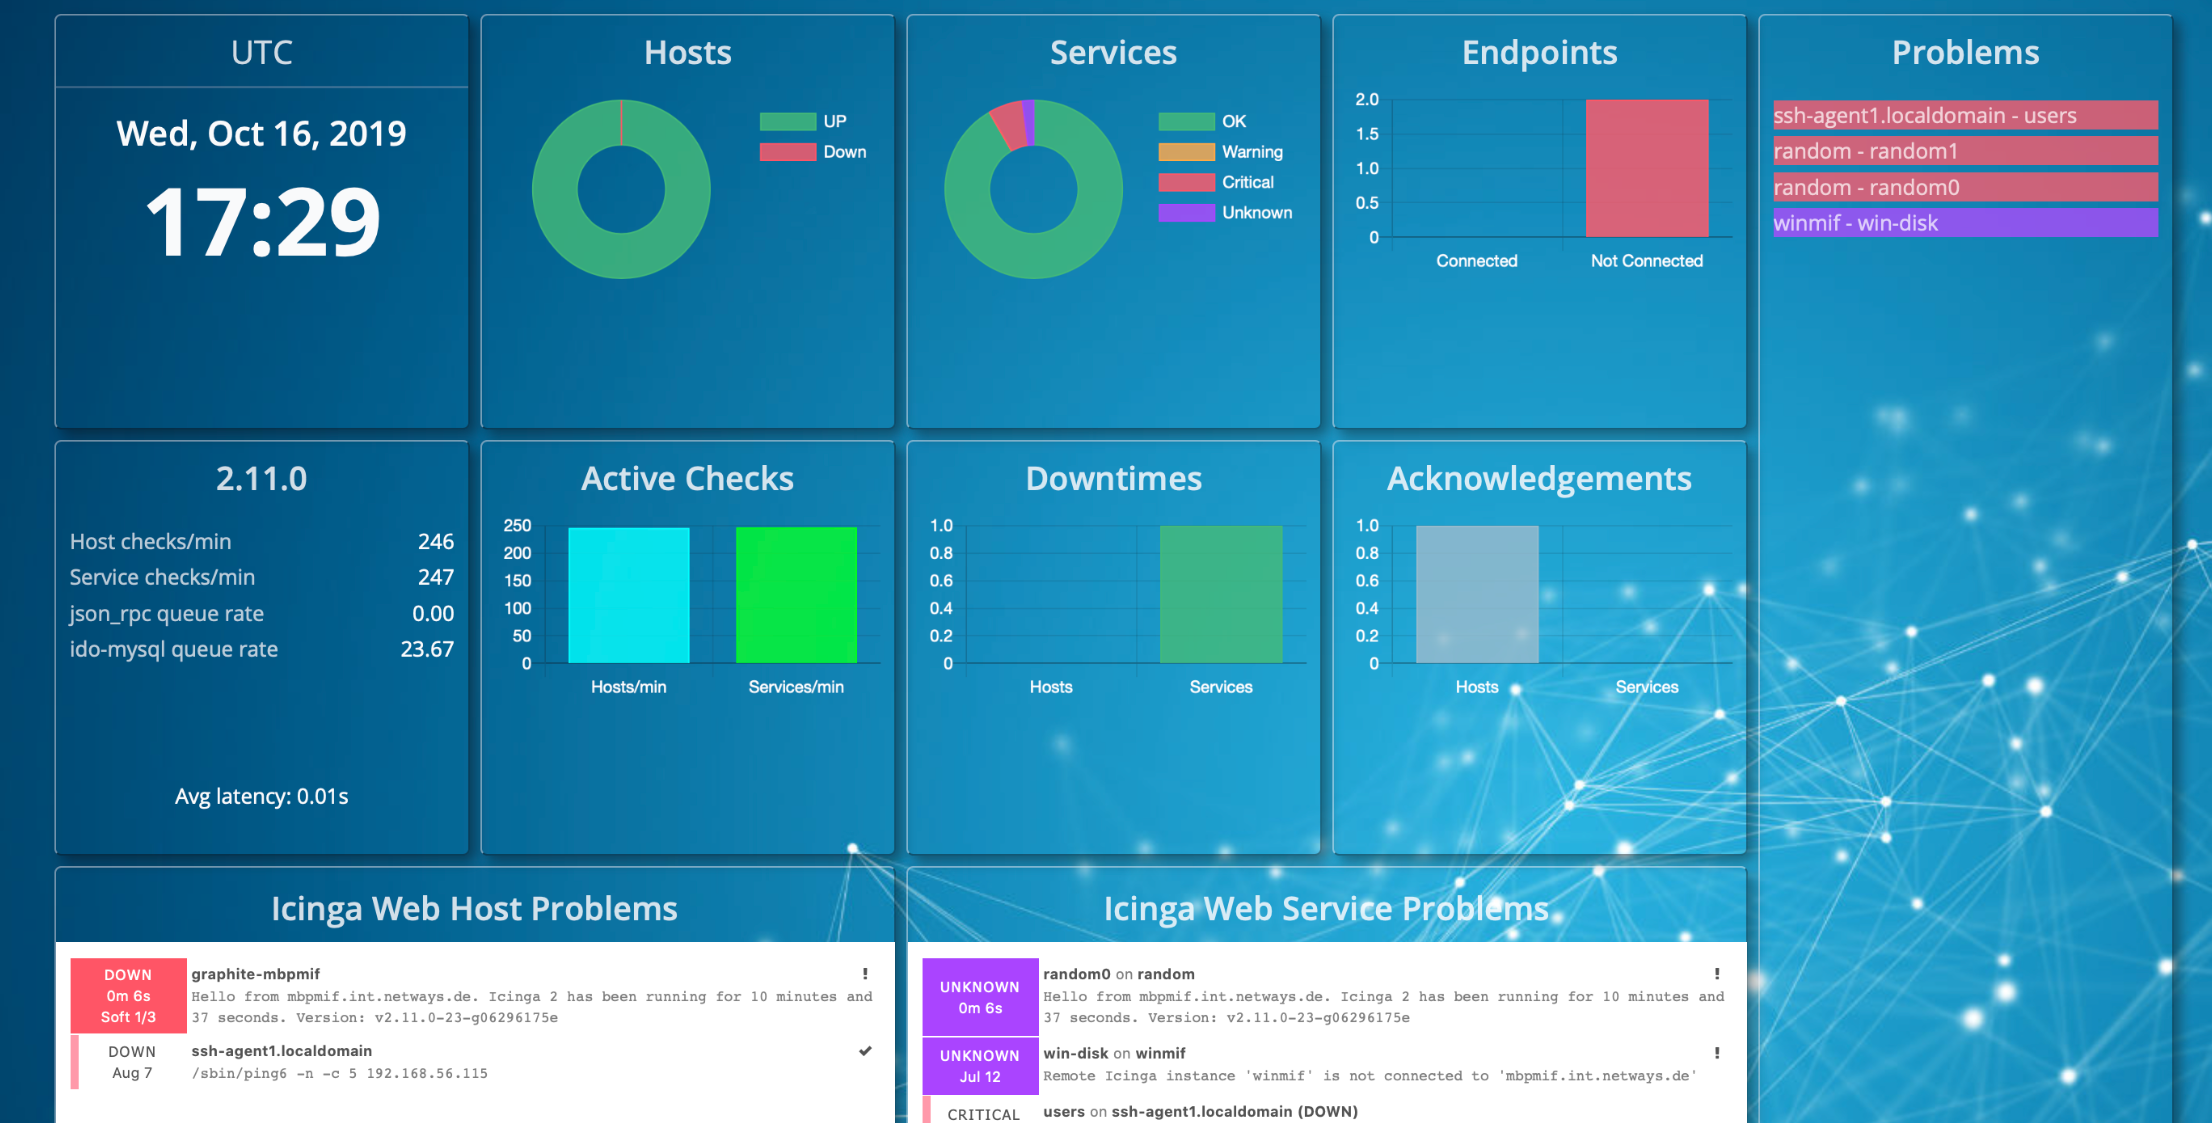
This demo is built using the official Icinga2 GitHub Repo, and a community GitHub Repo.
Product Deployment
Pre-Reqs
Use the following docker configuration to get things set up, but it is 1000% easier and a better choice to install a binary or from source; some unique exchanges in the docker process here make things needlessly complex.
-
- Create the folders for persistent volumes
sudo mkdir -p /docker/icinga2
- Navigate to the root directory for the container
cd /docker/icinga2
- Create the docker compose file
sudo nano docker-compose.yml
- Paste the docker compose code below and save the document
- Continue to create files provided in the headers below using their respective code
- icingadb.conf, init-icinga2.sh, init-mysql.sh
- Create the folders for persistent volumes
Docker Compose
version: '3.7'

x-icinga-db-web-config:
  &icinga-db-web-config
  icingaweb.modules.icingadb.config.icingadb.resource: icingadb
  icingaweb.modules.icingadb.redis.redis1.host: icingadb-redis
  icingaweb.modules.icingadb.redis.redis1.port: 6379
  icingaweb.modules.icingadb.commandtransports.icinga2.host: icinga2
  icingaweb.modules.icingadb.commandtransports.icinga2.port: 5665
  icingaweb.modules.icingadb.commandtransports.icinga2.password: ${ICINGAWEB_ICINGA2_API_USER_PASSWORD:-icingaweb}
  icingaweb.modules.icingadb.commandtransports.icinga2.transport: api
  icingaweb.modules.icingadb.commandtransports.icinga2.username: icingaweb
  icingaweb.resources.icingadb.charset: utf8mb4
  icingaweb.resources.icingadb.db: mysql
  icingaweb.resources.icingadb.dbname: icingadb
  icingaweb.resources.icingadb.host: mysql
  icingaweb.resources.icingadb.password: ${ICINGADB_MYSQL_PASSWORD:-icingadb}
  icingaweb.resources.icingadb.type: db
  icingaweb.resources.icingadb.username: icingadb

x-icinga-director-config:
  &icinga-director-config
  icingaweb.modules.director.config.db.resource: director-mysql
  icingaweb.modules.director.kickstart.config.endpoint: icinga2
  icingaweb.modules.director.kickstart.config.host: icinga2
  icingaweb.modules.director.kickstart.config.port: 5665
  icingaweb.modules.director.kickstart.config.username: icingaweb
  icingaweb.modules.director.kickstart.config.password: ${ICINGAWEB_ICINGA2_API_USER_PASSWORD:-icingaweb}
  icingaweb.resources.director-mysql.charset: utf8mb4
  icingaweb.resources.director-mysql.db: mysql
  icingaweb.resources.director-mysql.dbname: director
  icingaweb.resources.director-mysql.host: mysql
  icingaweb.resources.director-mysql.password: ${ICINGA_DIRECTOR_MYSQL_PASSWORD:-director}
  icingaweb.resources.director-mysql.type: db
  icingaweb.resources.director-mysql.username: director

x-icinga-web-config:
  &icinga-web-config
  icingaweb.authentication.icingaweb2.backend: db
  icingaweb.authentication.icingaweb2.resource: icingaweb-mysql
  icingaweb.config.global.config_backend: db
  icingaweb.config.global.config_resource: icingaweb-mysql
  icingaweb.config.global.module_path: /usr/share/icingaweb2/modules
  icingaweb.config.logging.log: php
  icingaweb.groups.icingaweb2.backend: db
  icingaweb.groups.icingaweb2.resource: icingaweb-mysql
  icingaweb.passwords.icingaweb2.icingaadmin: icinga
  icingaweb.resources.icingaweb-mysql.charset: utf8mb4
  icingaweb.resources.icingaweb-mysql.db: mysql
  icingaweb.resources.icingaweb-mysql.dbname: icingaweb
  icingaweb.resources.icingaweb-mysql.host: mysql
  icingaweb.resources.icingaweb-mysql.password: icingaweb
  icingaweb.resources.icingaweb-mysql.type: db
  icingaweb.resources.icingaweb-mysql.username: icingaweb
  icingaweb.roles.Administrators.groups: Administrators
  icingaweb.roles.Administrators.permissions: '*'
  icingaweb.roles.Administrators.users: icingaadmin

x-icinga2-environment:
  &icinga2-environment
  ICINGA_CN: icinga2
  ICINGA_MASTER: 1

x-logging:
  &default-logging
  driver: "json-file"
  options:
    max-file: "10"
    max-size: "1M"

networks:
  default:
    name: icinga-playground

services:
  director:
    command:
      - /bin/bash
      - -ce
      - |
        echo "Testing the database connection. Container could restart."
        (echo > /dev/tcp/mysql/3306) >/dev/null 2>&1
        echo "Testing the Icinga 2 API connection. Container could restart."
        (echo > /dev/tcp/icinga2/5665) >/dev/null 2>&1
        icingacli director migration run
        (icingacli director kickstart required && icingacli director kickstart run && icingacli director config deploy) || true
        echo "Starting Icinga Director daemon."
        icingacli director daemon run
    entrypoint: []
    logging: *default-logging
    image: icinga/icingaweb2
    restart: on-failure
    volumes:
      - icingaweb:/data

  init-icinga2:
    command: [ "/config/init-icinga2.sh" ]
    environment: *icinga2-environment
    image: icinga/icinga2
    logging: *default-logging
    volumes:
      - icinga2:/data
      - /docker/icinga2/icingadb.conf:/config/icingadb.conf
      - /docker/icinga2/icingaweb-api-user.conf:/config/icingaweb-api-user.conf
      - /docker/icinga2/init-icinga2.sh:/config/init-icinga2.sh

  icinga2:
    command: [ "sh", "-c", "sleep 5 ; icinga2 daemon" ]
    depends_on:
      - icingadb-redis
      - init-icinga2
    environment: *icinga2-environment
    image: icinga/icinga2
    logging: *default-logging
    ports:
      - 5665:5665
    volumes:
      - icinga2:/data
      - /docker/icinga2/icinga2.conf.d:/custom_data/custom.conf.d

  icingadb:
    environment:
      ICINGADB_DATABASE_HOST: mysql
      ICINGADB_DATABASE_PORT: 3306
      ICINGADB_DATABASE_DATABASE: icingadb
      ICINGADB_DATABASE_USER: icingadb
      ICINGADB_DATABASE_PASSWORD: ${ICINGADB_MYSQL_PASSWORD:-icingadb}
      ICINGADB_REDIS_HOST: icingadb-redis
      ICINGADB_REDIS_PORT: 6379
    depends_on:
      - mysql
      - icingadb-redis
    image: icinga/icingadb
    logging: *default-logging

  icingadb-redis:
    image: redis
    logging: *default-logging

  icingaweb:
    depends_on:
      - mysql
    environment:
      icingaweb.enabledModules: director, icingadb, incubator
      <<: [*icinga-db-web-config, *icinga-director-config, *icinga-web-config]
    logging: *default-logging
    image: icinga/icingaweb2
    ports:
      - 8080:8080
    # Restart Icinga Web container automatically since we have to wait for the database to be ready.
    # Please note that this needs a more sophisticated solution.
    restart: on-failure
    volumes:
      - icingaweb:/data

  mysql:
    image: mariadb:10.7
    command: --default-authentication-plugin=mysql_native_password
    environment:
      MYSQL_RANDOM_ROOT_PASSWORD: 1
      ICINGADB_MYSQL_PASSWORD: ${ICINGADB_MYSQL_PASSWORD:-icingadb}
      ICINGAWEB_MYSQL_PASSWORD: ${ICINGAWEB_MYSQL_PASSWORD:-icingaweb}
      ICINGA_DIRECTOR_MYSQL_PASSWORD: ${ICINGA_DIRECTOR_MYSQL_PASSWORD:-director}
    logging: *default-logging
    volumes:
      - mysql:/var/lib/mysql
      - /docker/icinga2/env/mysql/:/docker-entrypoint-initdb.d/

volumes:
  icinga2:
  icingaweb:
  mysql:
You will need to make the following files in addition to the docker-compose.yaml:
icingadb.conf
library "icingadb"

object IcingaDB "icingadb" {
    host = "icingadb-redis"
    port = 6379
}
icingaweb-api-user.conf
object ApiUser "icingaweb" {
  password = "$ICINGAWEB_ICINGA2_API_USER_PASSWORD"
  permissions = [ "*" ]
}
init-icinga2.sh
Before you make init-icinga2.sh, cd /docker/icinga2/env/icinga2
#!/usr/bin/env bash

set -e
set -o pipefail

if [ ! -f /data/etc/icinga2/conf.d/icingaweb-api-user.conf ]; then
  sed "s/\$ICINGAWEB_ICINGA2_API_USER_PASSWORD/${ICINGAWEB_ICINGA2_API_USER_PASSWORD:-icingaweb}/" /config/icingaweb-api-user.conf >/data/etc/icinga2/conf.d/icingaweb-api-user.conf
fi

if [ ! -f /data/etc/icinga2/features-enabled/icingadb.conf ]; then
  mkdir -p /data/etc/icinga2/features-enabled
  cat /config/icingadb.conf >/data/etc/icinga2/features-enabled/icingadb.conf
fi
init-mysql.sh
Before creating init-mysql.sh, cd /docker/icinga2/env/mysql
#!/bin/sh -x

create_database_and_user() {
    DB=$1
    USER=$2
    PASSWORD=$3

    mysql --user root --password=$MYSQL_ROOT_PASSWORD <<EOS
CREATE DATABASE IF NOT EXISTS ${DB};
CREATE USER IF NOT EXISTS  '${USER}'@'%' IDENTIFIED BY '${PASSWORD}';
GRANT ALL ON ${DB}.* TO '${USER}'@'%';
EOS
}

create_database_and_user director director ${ICINGA_DIRECTOR_MYSQL_PASSWORD}
create_database_and_user icingadb icingadb ${ICINGADB_MYSQL_PASSWORD}
create_database_and_user icingaweb icingaweb ${ICINGAWEB_MYSQL_PASSWORD}
Application Config
-
- Update file permissions on the two scripts
sudo chmod +x /docker/icinga2/env/mysql/init-mysql.shsudo chmod +x /docker/icinga2/init-icinga2.sh
- Start the Container
sudo docker compose -p icinga-playground up -d
- Navigate to the ip of the website on port 8080
- The API listens on port 5665
- Login with icingaadmin and icinga
- API login is icingaweb and icingaweb
- Use the new “Director” platform to provision hosts and services
- Update file permissions on the two scripts
Again, using this method of installation makes an already difficult product even more difficult. To get this docker build working past this point, you are on your own.
Application#6 Zabbix
Product Introduction
Zabbix is a bit of a spiderweb for their docker configuration so I found it much simpler just to clone the repo and work with it locally or use a third party compose solution (which is what I do below). While certainly a very common enterprise solution, I believe it has been slowly falling behind some of the earlier solutions in this article.
Post-Instructions Screenshot:
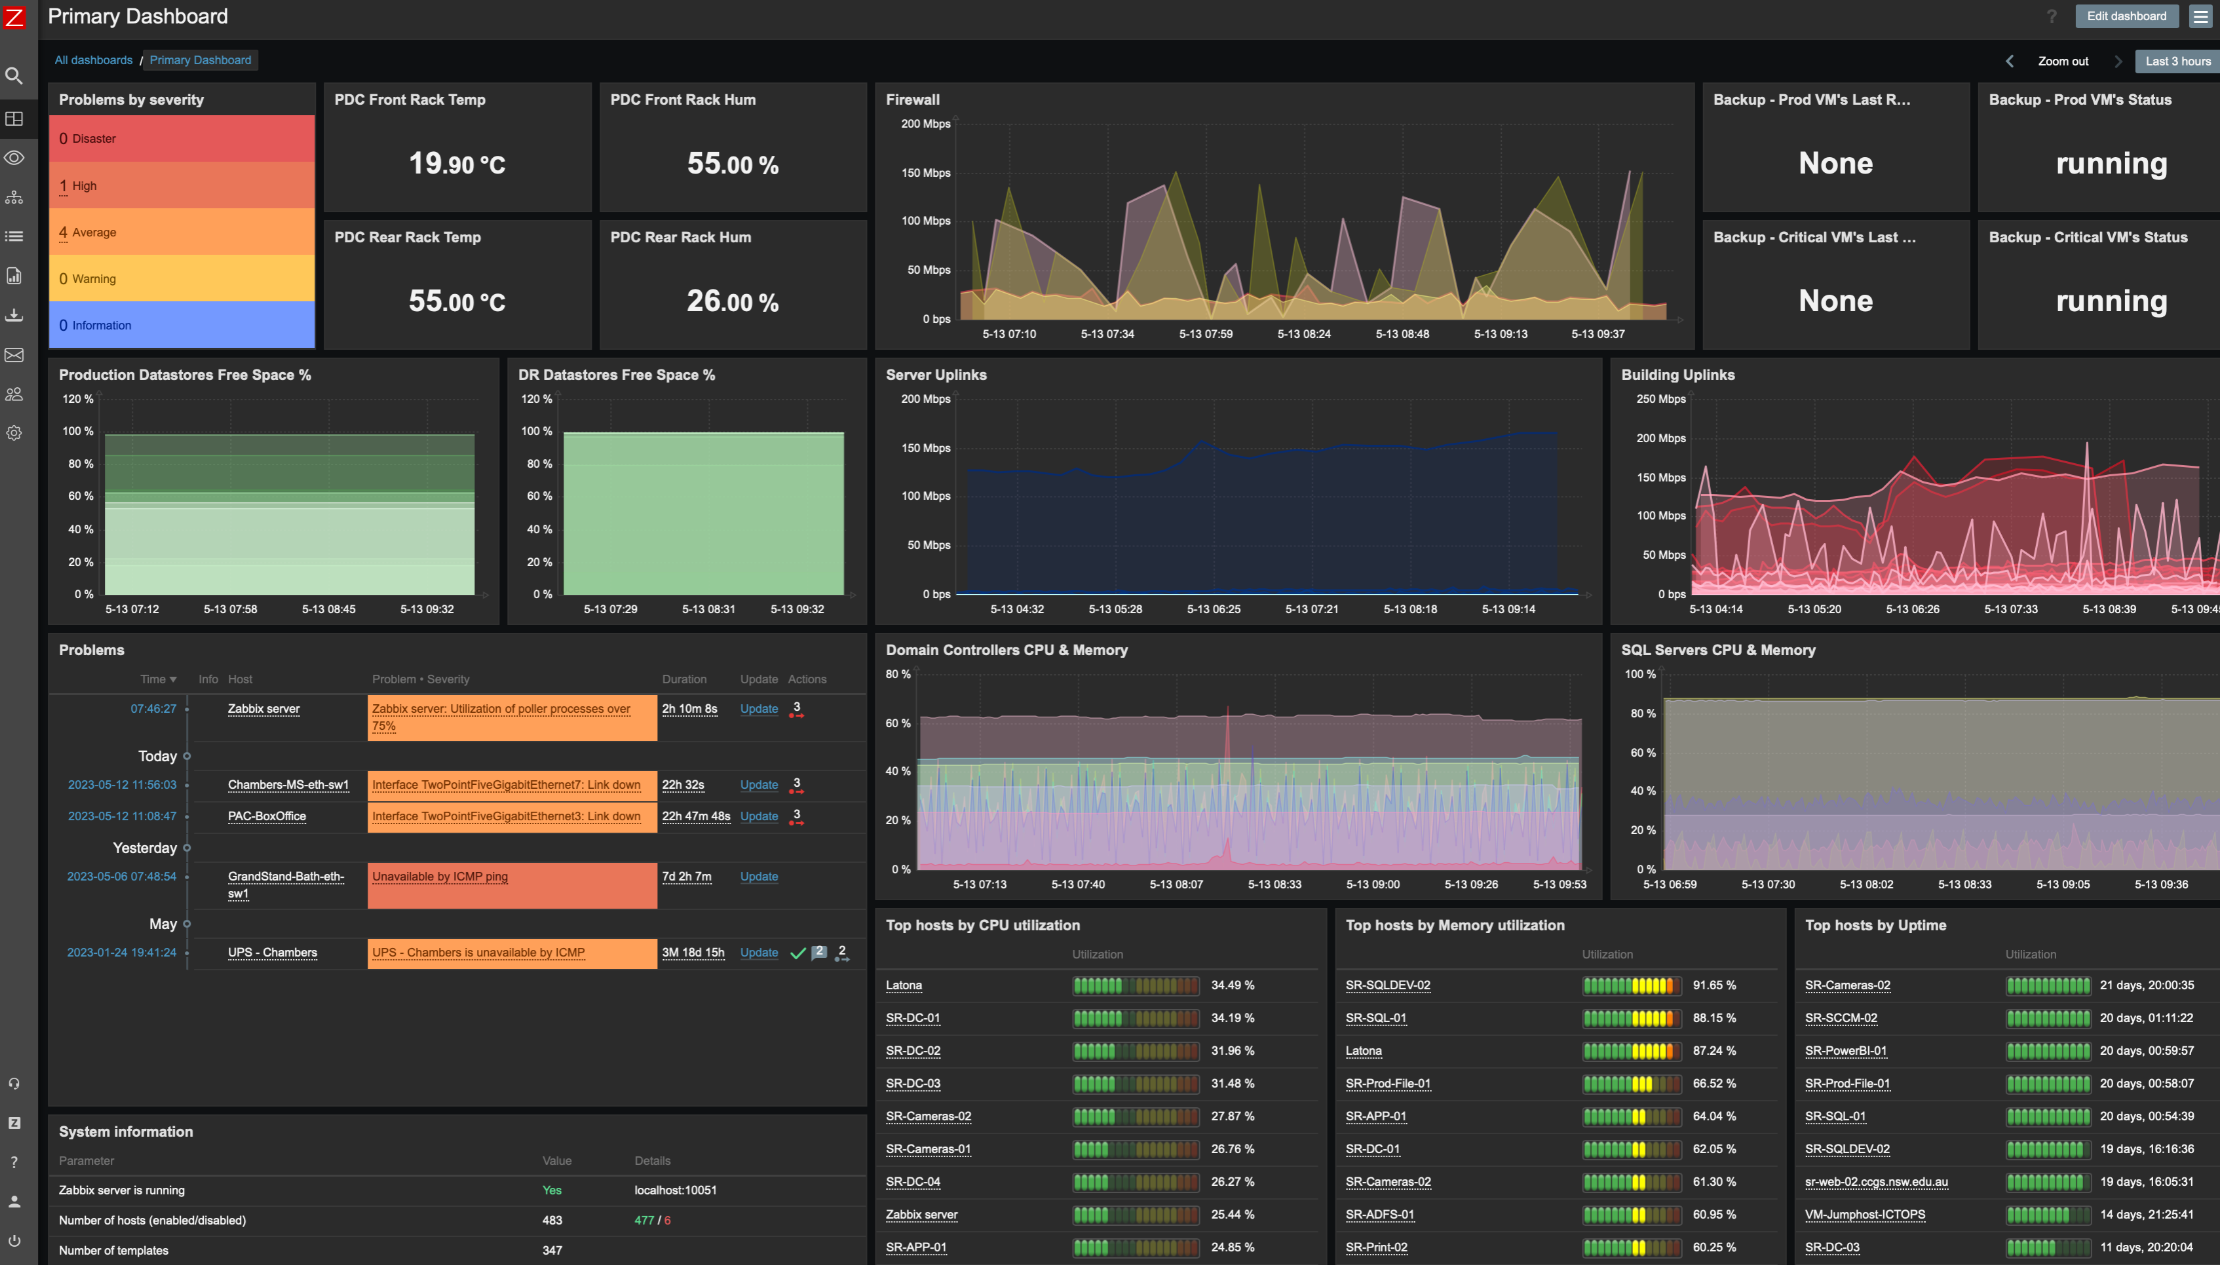
This demo is built using the official Zabbix GitHub Repo, and a community GitHub Repo.
Product Deployment
Pre-Reqs
- Create the root folder
sudo mkdir -p /docker/Zabbix/
- Navigate to the root directory for the container
cd /docker/Zabbix
- Create the remaining folder for persistent volumes
sudo mkdir -p zabbix-db/mariadb zabbix-db/backups zabbix-server/alertscripts zabbix-server/externalscripts zabbix-server/dbscripts zabbix-server/export zabbix-server/modules zabbix-server/enc zabbix-server/ssh_keys zabbix-server/mibs zabbix-web/nginx zabbix-web/modules/
- Create the docker compose file
sudo nano docker-compose.yaml
- Paste the docker compose code below and save the document
-
Docker Compose
version: '3.3'

services:
  zabbix-db:
    container_name: zabbix-db
    image: mariadb:10.11.4
    restart: always
    volumes:
      - ${ZABBIX_DATA_PATH}/zabbix-db/mariadb:/var/lib/mysql:rw
      - ${ZABBIX_DATA_PATH}/zabbix-db/backups:/backups
    command:
      - mariadbd
      - --character-set-server=utf8mb4
      - --collation-server=utf8mb4_bin
#      - --default-authentication-plugin=mysql_native_password
    environment:
      - MYSQL_USER=${MYSQL_USER}
      - MYSQL_PASSWORD=${MYSQL_PASSWORD}
      - MYSQL_ROOT_PASSWORD=${MYSQL_ROOT_PASSWORD}
    stop_grace_period: 1m

  zabbix-server:
    container_name: zabbix-server
    image: zabbix/zabbix-server-mysql:ubuntu-6.4-latest
    restart: always
    ports:
      - 10051:10051
    volumes:
      - /etc/localtime:/etc/localtime:ro
      - ${ZABBIX_DATA_PATH}/zabbix-server/alertscripts:/usr/lib/zabbix/alertscripts:ro
      - ${ZABBIX_DATA_PATH}/zabbix-server/externalscripts:/usr/lib/zabbix/externalscripts:ro
      - ${ZABBIX_DATA_PATH}/zabbix-server/dbscripts:/var/lib/zabbix/dbscripts:ro
      - ${ZABBIX_DATA_PATH}/zabbix-server/export:/var/lib/zabbix/export:rw
      - ${ZABBIX_DATA_PATH}/zabbix-server/modules:/var/lib/zabbix/modules:ro
      - ${ZABBIX_DATA_PATH}/zabbix-server/enc:/var/lib/zabbix/enc:ro
      - ${ZABBIX_DATA_PATH}/zabbix-server/ssh_keys:/var/lib/zabbix/ssh_keys:ro
      - ${ZABBIX_DATA_PATH}/zabbix-server/mibs:/var/lib/zabbix/mibs:ro
    environment:
      - MYSQL_ROOT_USER=root
      - MYSQL_ROOT_PASSWORD=${MYSQL_ROOT_PASSWORD}
      - DB_SERVER_HOST=zabbix-db
      - ZBX_STARTPINGERS=${ZBX_STARTPINGERS}
    depends_on:
      - zabbix-db
    stop_grace_period: 30s
    sysctls:
      - net.ipv4.ip_local_port_range=1024 65000
      - net.ipv4.conf.all.accept_redirects=0
      - net.ipv4.conf.all.secure_redirects=0
      - net.ipv4.conf.all.send_redirects=0

  zabbix-web:
    container_name: zabbix-web
    image: zabbix/zabbix-web-nginx-mysql:ubuntu-6.4-latest
    restart: always
    ports:
      - 8080:8080
    volumes:
      - /etc/localtime:/etc/localtime:ro
      - ${ZABBIX_DATA_PATH}/zabbix-web/nginx:/etc/ssl/nginx:ro
      - ${ZABBIX_DATA_PATH}/zabbix-web/modules/:/usr/share/zabbix/modules/:ro
    environment:
      - MYSQL_USER=${MYSQL_USER}
      - MYSQL_PASSWORD=${MYSQL_PASSWORD}
      - DB_SERVER_HOST=zabbix-db
      - ZBX_SERVER_HOST=zabbix-server
      - ZBX_SERVER_NAME=Zabbix Docker
      - PHP_TZ=America/Denver
    depends_on:
      - zabbix-db
      - zabbix-server
    stop_grace_period: 10s
You will need to make the following files in addition to the docker-compose.yaml:
.env
MYSQL_USER=zabbix\nMYSQL_PASSWORD=zabbix\nMYSQL_ROOT_PASSWORD=FiY3G39pLqvktDbDM1mr\nZABBIX_DATA_PATH=/docker/Zabbix\nZBX_STARTPINGERS=2I cant seem to get the zabbix-server to take the enviornment variable and build the config in /etc/zabbix/zabbix_server.conf so I left MYSQL_USER and MYSQL_PASSWORD at the defaults, dont do this in production.
Application Config
-
- Navigate to the webserver on port 8080
- Default login is Admin/zabbix
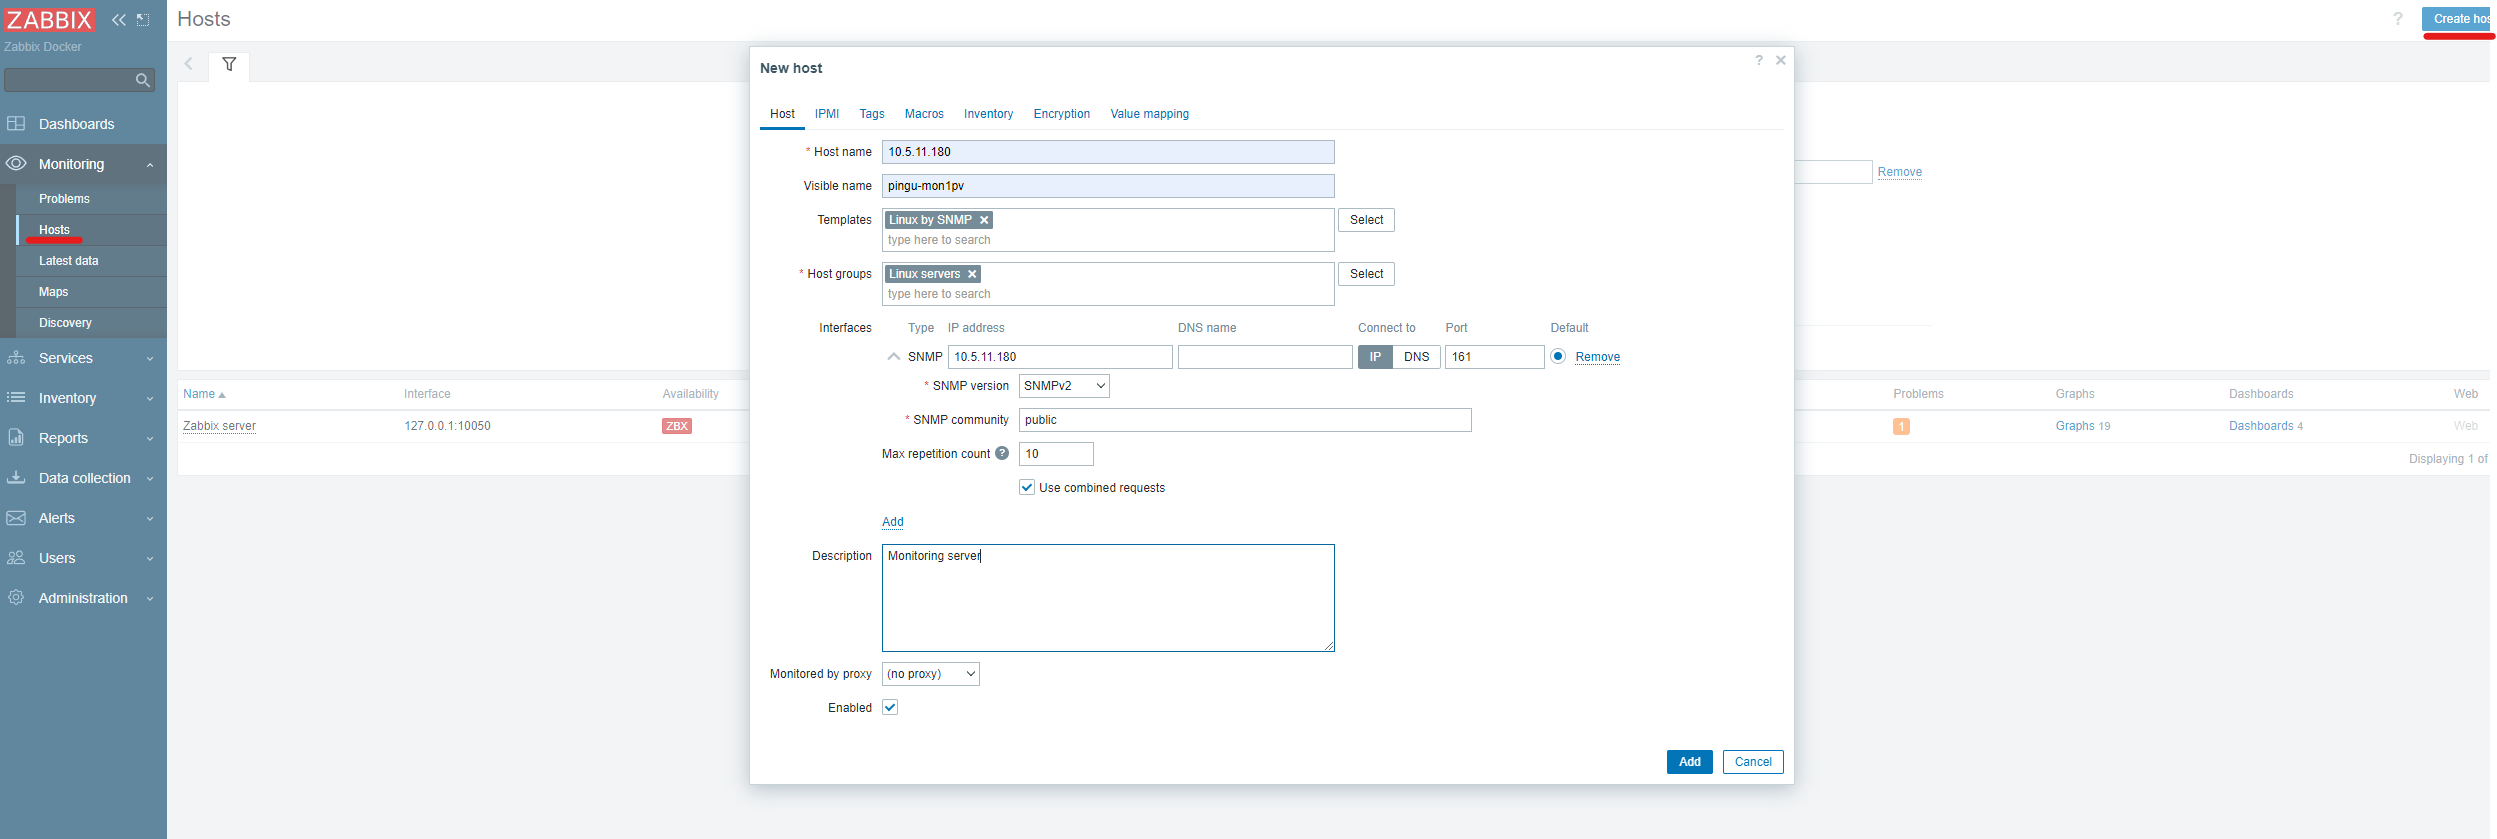
- Click on the Monitoring dropdown on the far left
- Select the Hosts option and click “Create Host” in the upper right
- I just built a basic SNMP connection but Zabbix supports most methods of discovery and monitoring
- Navigate to the webserver on port 8080
Application#7 Nagios
Product Introduction
Nagios was the leader in monitoring and management for many years and is still one of the most widely deployed solutions. It has an extensive dev community that builds plugins and UIs. It is not as aesthetically appealing as some competitors, but it makes up for in features and flexibility. There are a significant number of add-ons, plugins, UIs, themes, integrations, etc., that allow the Nagios product to be more than just a monitoring solution.
It is not designed for Docker containers, and similar to Ichinga2, you will get a much more stable experience running the application directly on the OS rather than with Docker. The original Nagios is still maintained and presented as an enterprise-grade open-source solution. It still behaves and looks like the original from the early 2000s and goes by “Nagios Core.” Their fancy version that markets itself as the industry-leading solution is “Nagios XI” and offers many more features and integrations with the base installation.
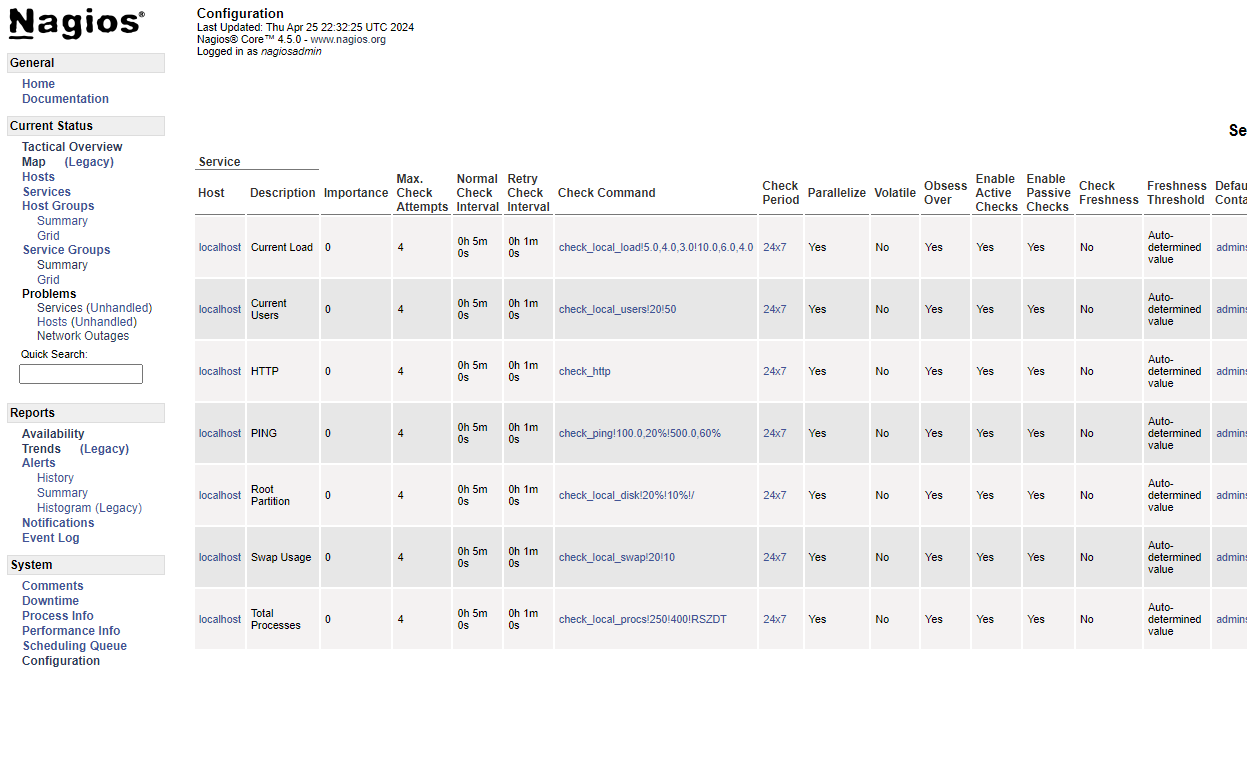
Not a fancy dashboards guy so I borrowed this Post-Install Screenshot from their repo:
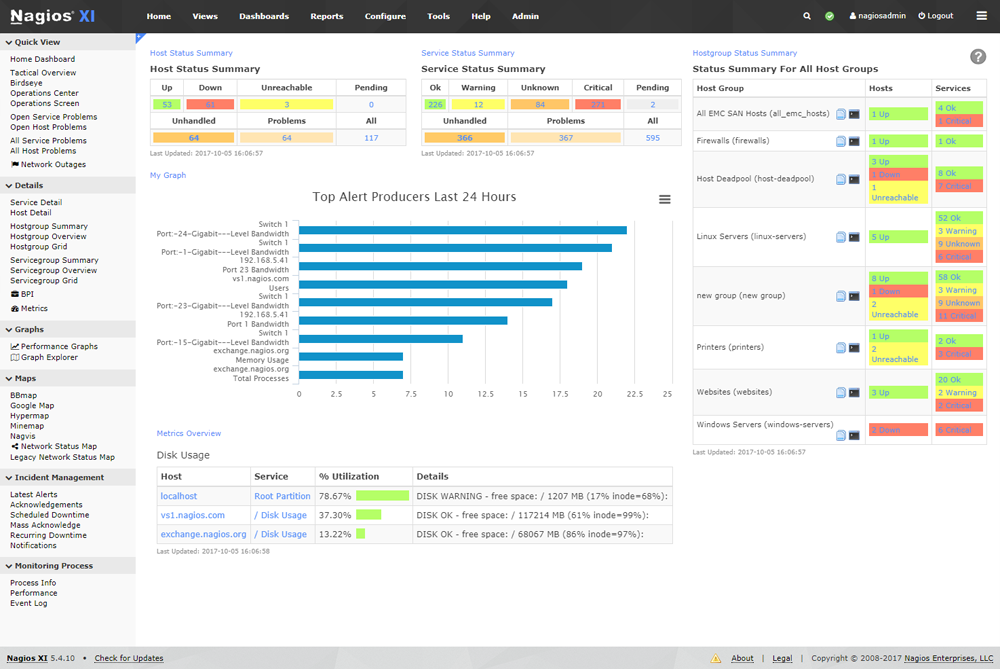
This demo is built using the official Nagios GitHub Repo, and a community GitHub Repo.
Product Deployment
Pre-Reqs
- Create the root volume for the container
sudo mkdir -p /docker/Nagios
- Navigate to the root directory for the container
cd /docker/Nagios
- Create the docker compose file
sudo nano docker-compose.yml
- Paste the docker compose code below and save the document
Docker Compose
version: '3'
services:
  nagios:
    image: jasonrivers/nagios:latest
    restart: always
    ports:
      - 8080:80
    volumes:
    - nagiosetc:/opt/nagios/etc
    - nagiosvar:/opt/nagios/var
    - customplugins:/opt/Custom-Nagios-Plugins
    - nagiosgraphvar:/opt/nagiosgraph/var
    - nagiosgraphetc:/opt/nagiosgraph/etc

volumes:
    nagiosetc:
    nagiosvar:
    customplugins:
    nagiosgraphvar:
    nagiosgraphetc:
You don’t actually configure Nagios from the web interface (with the base installation) and primarily work with local config files. Most people leverage plugins like NRPE to enhance the configuration but we are just going to do this the traditional way by making files in /var/lib/docker/volumes/nagios_nagiosetc/objects. Update the values in the template files below.
hosts.cfg
define hostgroup {
    hostgroup_name    linux-hostgroup
    alias             linux servers
}
define host {
    name                     linux-template
    use                      generic-host
    check_period             24x7
    check_interval           1
    retry_interval           1
    max_check_attempts       10
    check_command            check-host-alive
    notification_period      24x7
    notification_interval    30
    notification_options     d,r
    contact_groups           admins
    hostgroups               linux-hostgroup
    register                 0
}
define host {
    use                     linux-template
    host_name               myhost
    alias                   My Host
    address                 192.168.1.100
}
services.cfg
define service{
    name                            linux-service
    active_checks_enabled           1
    passive_checks_enabled          1
    parallelize_check               1
    obsess_over_service             1
    check_freshness                 0
    notifications_enabled           1
    event_handler_enabled           1
    flap_detection_enabled          1
    process_perf_data               1
    retain_status_information       1
    retain_nonstatus_information    1
    is_volatile                     0
    check_period                    24x7
    max_check_attempts              3
    check_interval                  10
    retry_interval                  2
    contact_groups                  admins
    notification_options            w,u,c,r
    notification_interval           60
    notification_period             24x7
      register                      0
    }
define service {
    use                     linux-service
    host_name               myhost
    service_description     PING
    check_command           check_ping!100.0,20%!500.0,60%
}
Application Config
-
- Start the Docker container
sudo docker compose up -d
- Navigate to the webserver on port 8080
- Default login is nagiosadmin/nagios
- View the base dashboards on nagios core using the “current status” menu on the left
- Start the Docker container
Application#8 Munin
Product Introduction
Munin is a monitoring system typically deployed with a partner program (Hunin) that handles orchestration and automation. Typically I see Munin set up as an information gathering tool and the information is piped to Nagios or Grafana for additional analysis and visualization. The usecase for Munin is the power it brings with its twin (Hunin) and that it is agent based which allows for easy configuration and management.
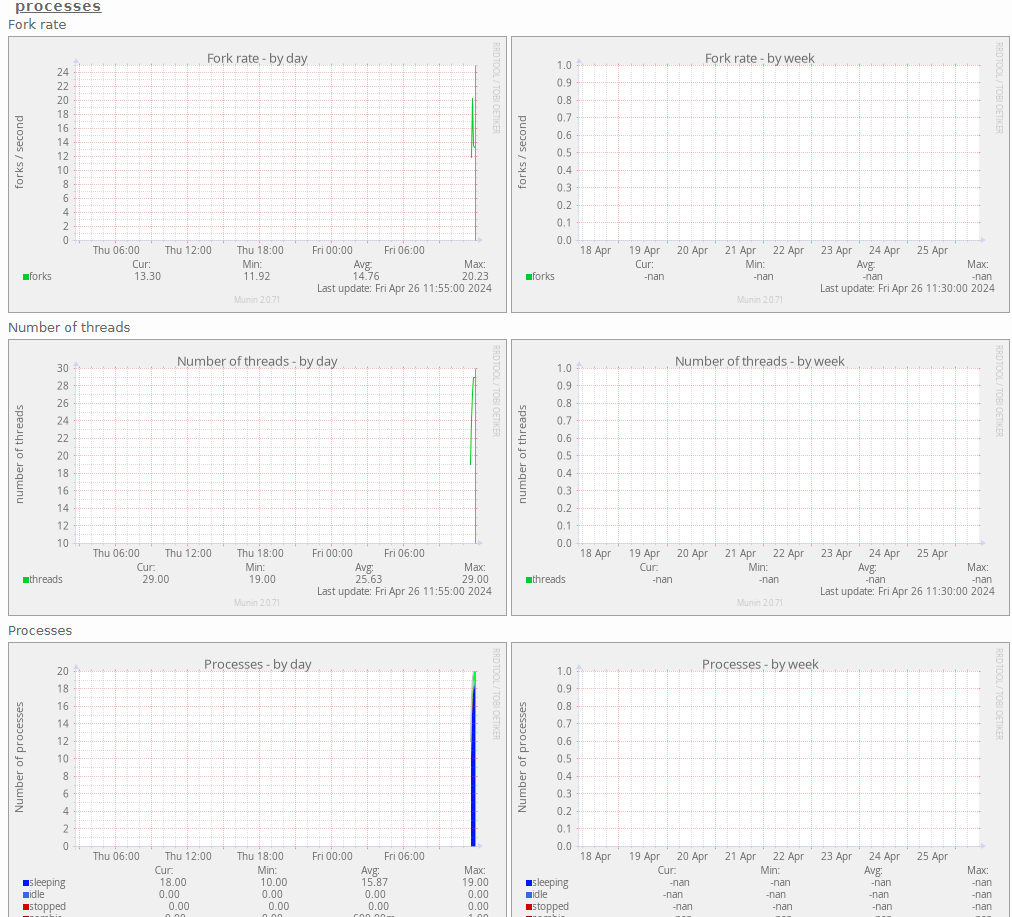
Post-Install Screenshot:
This demo is built using the official Munin GitHub Repo, and a community GitHub Repo.
Product Deployment
Pre-Reqs
- Create the root volume for the container
- sudo mkdir -p /docker/Munin/etc/munin/munin-conf.d:/etc/munin/munin-conf.d /docker/Munin/etc/munin/plugin-conf.d:/etc/munin/plugin-conf.d /docker/Munin/var/lib/munin:/var/lib/munin /docker/Munin/var/log/munin:/var/log/munin
- Navigate to the root directory for the container
cd /docker/Munin
- Create the docker compose file
sudo nano docker-compose.yml
- Paste the docker compose code below and save the document
Docker Compose
version: "3"

services:
  munin-server:
    container_name: "munin-server"
    image: aheimsbakk/munin-alpine
    restart: unless-stopped
    ports:
      - 80:80
    environment:
      NODES: server1:10.5.11.180
      TZ: America/Denver
    volumes:
      - /docker/Munin/etc/munin/munin-conf.d:/etc/munin/munin-conf.d
      - /docker/Munin/etc/munin/plugin-conf.d:/etc/munin/plugin-conf.d
      - /docker/Munin/var/lib/munin:/var/lib/munin
      - /docker/Munin/var/log/munin:/var/log/munin
Remote Host
You will need to install Munin agent on the endpoints you want to monitor:
- Install the Munin agent on a host you want to monitor
sudo sudo apt install munin-node
- Configure the Munin agent
sudo nano /etc/munin/munin-node.conf
- Add the ip address of your Munin controller with an “allow” statement
- RegEx in the form of ^172.28.1.1$
- Restart Munin Agent
sudo systemctl restart munin-node
We handled setting the remote endpoint on the Munin controller in the docker compose file but if you need to add anything after the fact: sudo nano/docker/Munin/etc/munin/munin-conf.d/nodes.conf
Application Config
-
- Start the Docker container
sudo docker compose up -d
- Navigate to the webserver on port 80
- Give it a minute if no immediate response
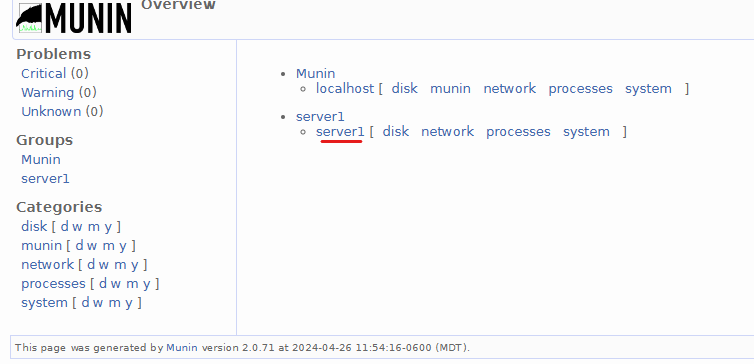
- Click on the host you created (server1) to access the graphs
- Start the Docker container
Application#9 Cacti
Product Introduction
Cacti is a very old monitoring tool that has continued to compete with Nagios for decades. It bosts a similar support and dev community to Nagios but provides much simpler configuration and management at the cost of less features (although very minimal functionality is lost).
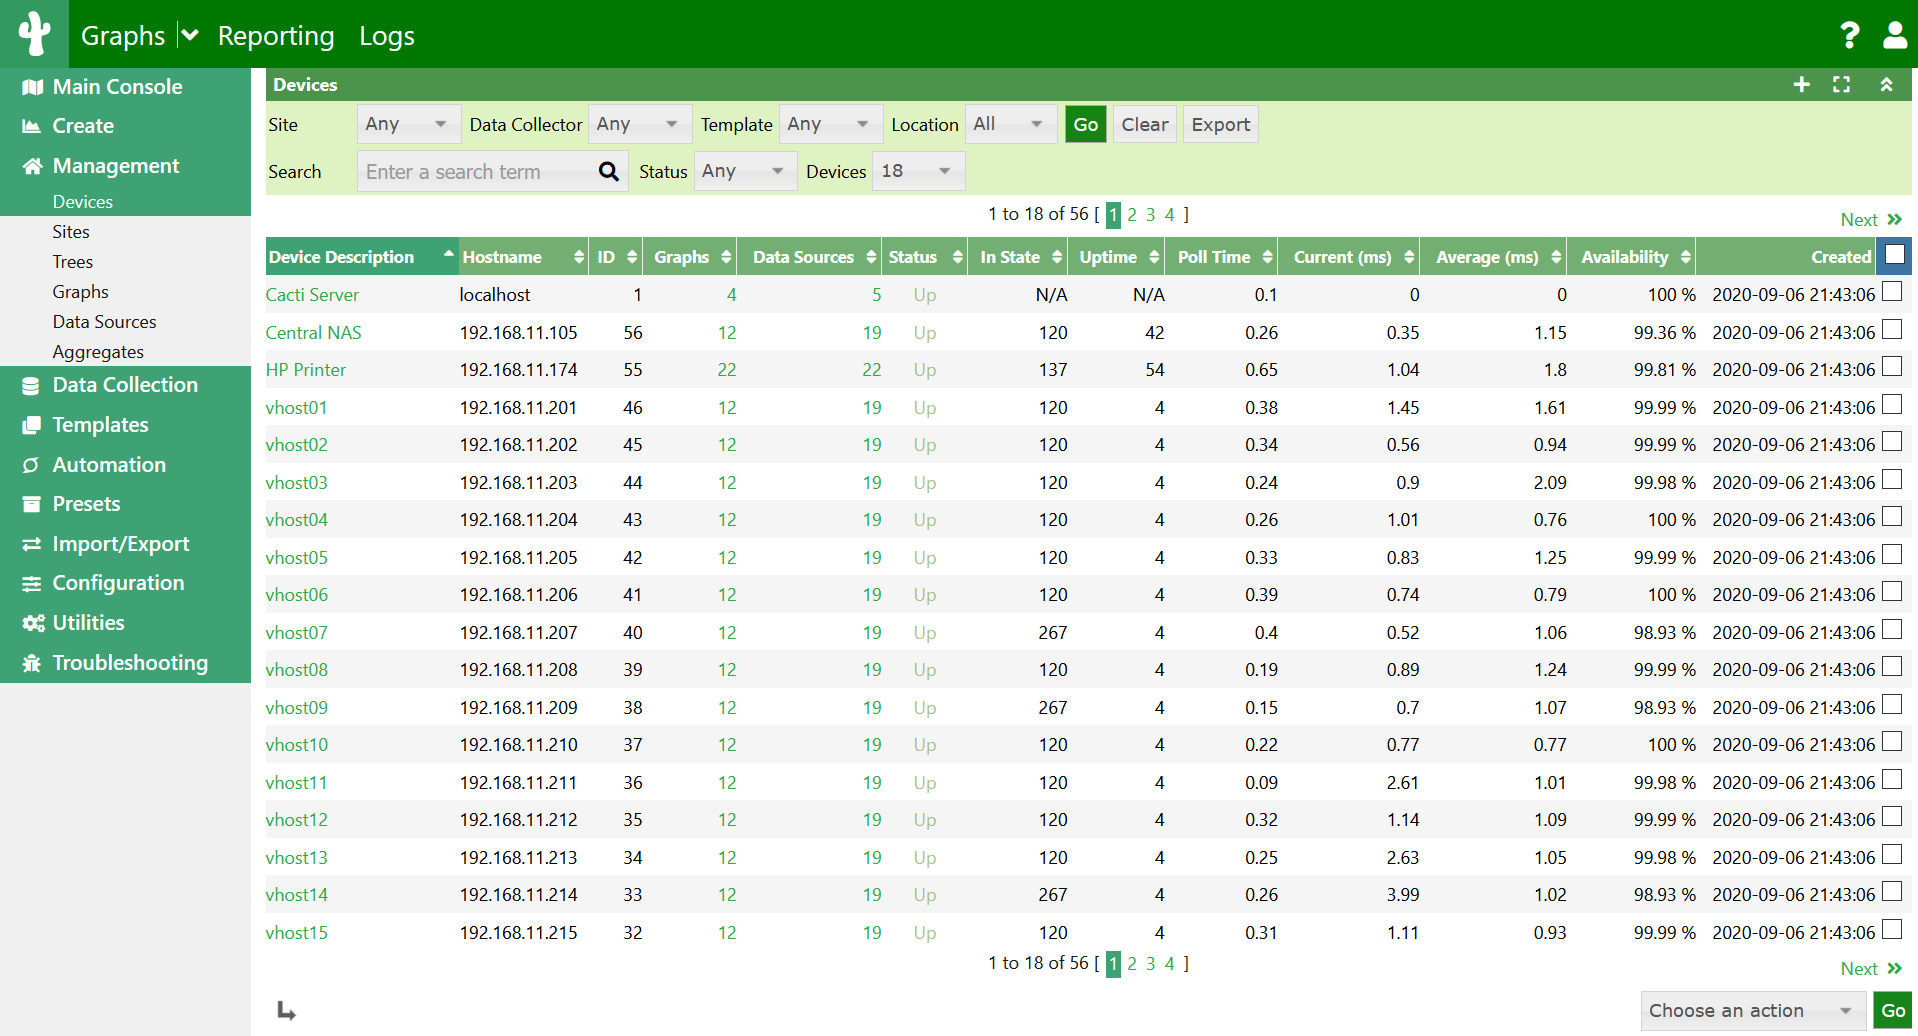
Post-Install Screenshot (borrowed from repo):
This demo is built using the official Cacti GitHub Repo, and a community GitHub Repo.
Product Deployment
Pre-Reqs
- Navigate to the root directory for the container
cd /docker/Cacti
- Create the docker compose file
sudo nano docker-compose.yml
- Paste the docker compose code below and save the document
Docker Compose
version: '3.5'
services:
  cacti:
    image: "smcline06/cacti"
    container_name: cacti
    hostname: cacti
    ports:
      - "80:80"
      - "443:443"
    environment:
      - DB_NAME=cacti_master
      - DB_USER=cactiuser
      - DB_PASS=cactipassword
      - DB_HOST=db
      - DB_PORT=3306
      - DB_ROOT_PASS=rootpassword
      - INITIALIZE_DB=1
      - TZ=America/Denver
    volumes:
      - cacti-data:/cacti
      - cacti-spine:/spine
      - cacti-backups:/backups
    links:
      - db
  db:
    image: "mariadb:10.3"
    container_name: cacti_db
    hostname: db
    ports:
      - "3306:3306"
    command:
      - mysqld
      - --character-set-server=utf8mb4
      - --collation-server=utf8mb4_unicode_ci
      - --max_connections=200
      - --max_heap_table_size=128M
      - --max_allowed_packet=32M
      - --tmp_table_size=128M
      - --join_buffer_size=128M
      - --innodb_buffer_pool_size=1G
      - --innodb_doublewrite=ON
      - --innodb_flush_log_at_timeout=3
      - --innodb_read_io_threads=32
      - --innodb_write_io_threads=16
      - --innodb_buffer_pool_instances=9
      - --innodb_file_format=Barracuda
      - --innodb_large_prefix=1
      - --innodb_io_capacity=5000
      - --innodb_io_capacity_max=10000
    environment:
      - MYSQL_ROOT_PASSWORD=rootpassword
      - TZ=America/Denver
    volumes:
      - cacti-db:/var/lib/mysql
volumes:
  cacti-db:
  cacti-data:
  cacti-spine:
  cacti-backups:
Application Config
-
- Start the Docker container
sudo docker compose up -d
- Navigate to the webserver on port 80
- Default login is admin/admin
- Set new admin password when prompted
- Set your theme and accept EULA on the following screen
- Review the pre-run checks and continue
- Select ‘new primary server’ and proceed to the next screen
- Accept any prechecks and script execution approval
- For the ‘default automation network’ specify a cidr range for auto detection
- Accept default templates and additional prechecks
- When prompted check the box indicating that you are ready to install and continue
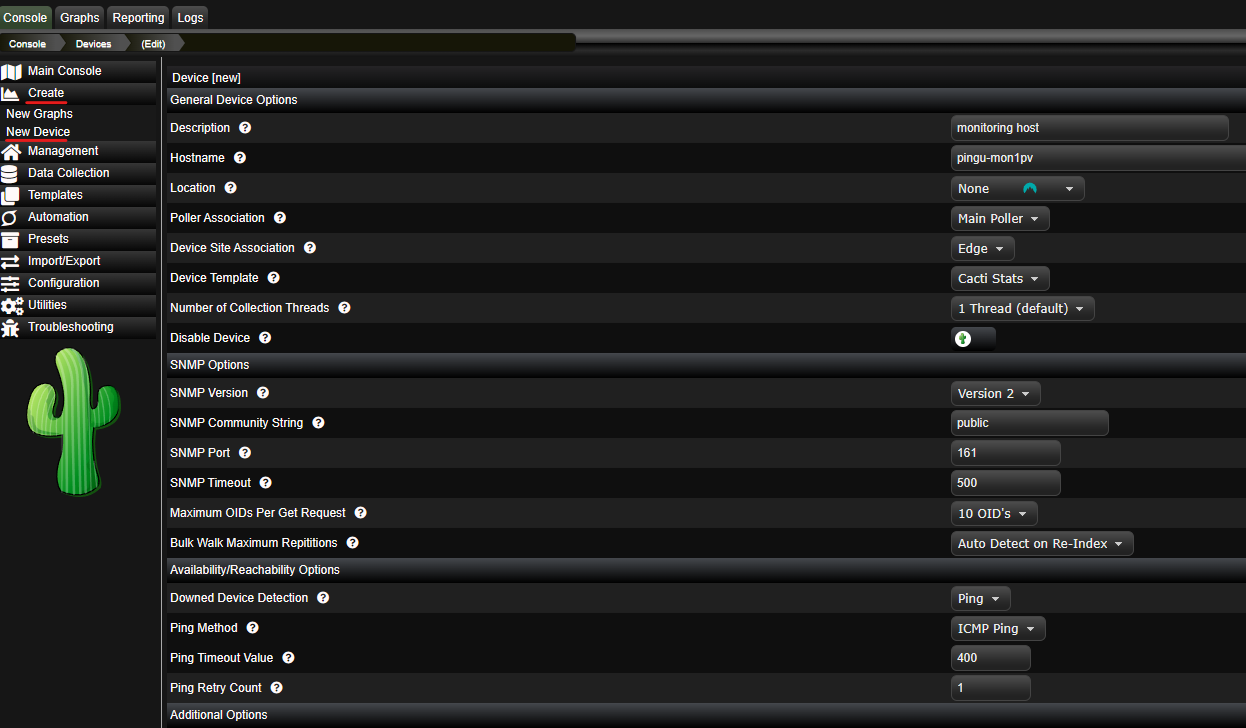
- On the console page click on ‘Create’ and then ‘New Device’ using the menu on the right
- Create any devices manually and create graphs for them using the same menu
- Start the Docker container
Application#10 PRTG
Product Introduction
PRTG is the most common monitoring solution I have encountered in newer environments (built somewhat recently and not an early 2000s build that has been updated over the years). PRTG is fast, powerful, and intuitive, it is widely supported and has excellent documentation.
There is no supported docker deployment of PRTG and I have not made a custom image yet. The only supported host for a PRTG probe is a Windows Server, to follow along with this solution you will need some kind of Windows Server license (free trial is fine). PRTG is free for the first 100 sensors, but it is not open source. I am including PRTG in this article as it is useful for most people to become familiar with any technology that is widely adopted and can be labbed at no cost.
Post-Install Screenshot:
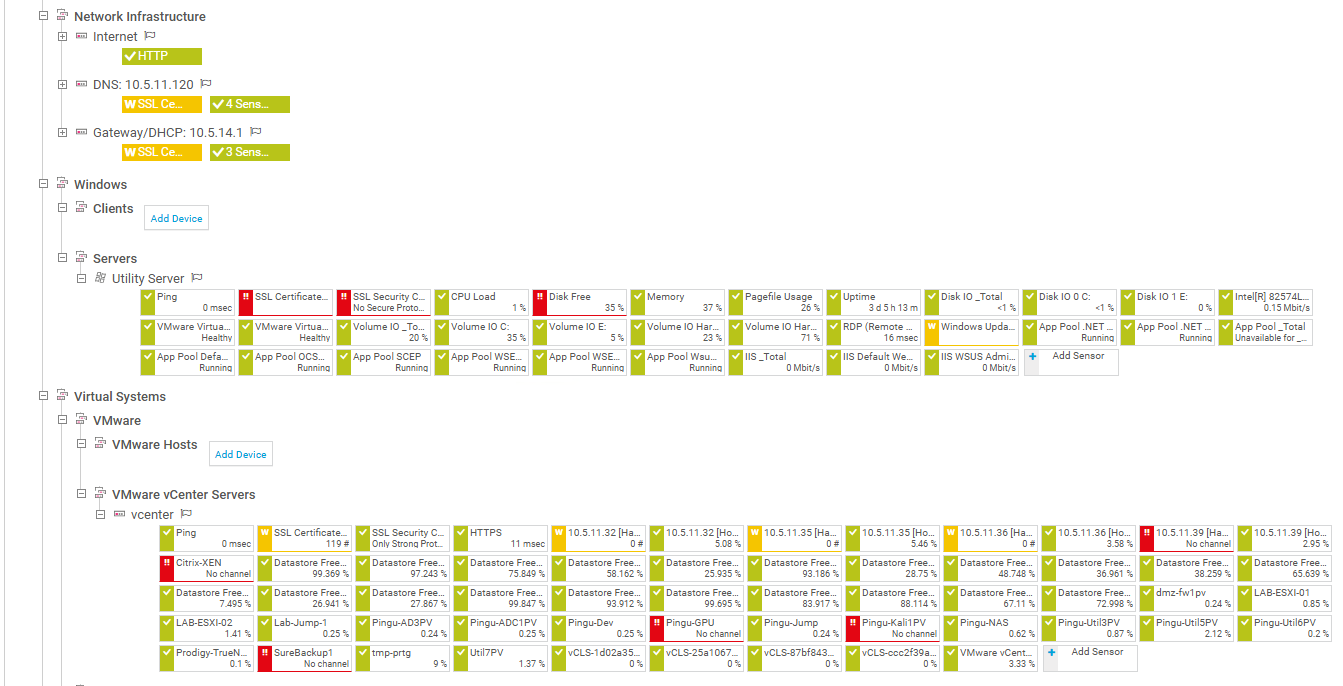
This demo is built using the official PRTG Installer.
Product Deployment
Pre-Reqs
- Download the PRTG installer and copy the license key from the download page
- Open the installer on a Windows Server
- Set the language
- Accept the EULA
- Provide a contact email address
- Select Express Install
Application Config
You should now have the “PRTG Administration Tool” application on this server. You can configure some settings for the Core Server using the Admin Tool but most of your work will be done via the web portal.
Add a Device
-
- Navigate to the webserver on port 80
- Default login is prtgadmin/prtgadmin
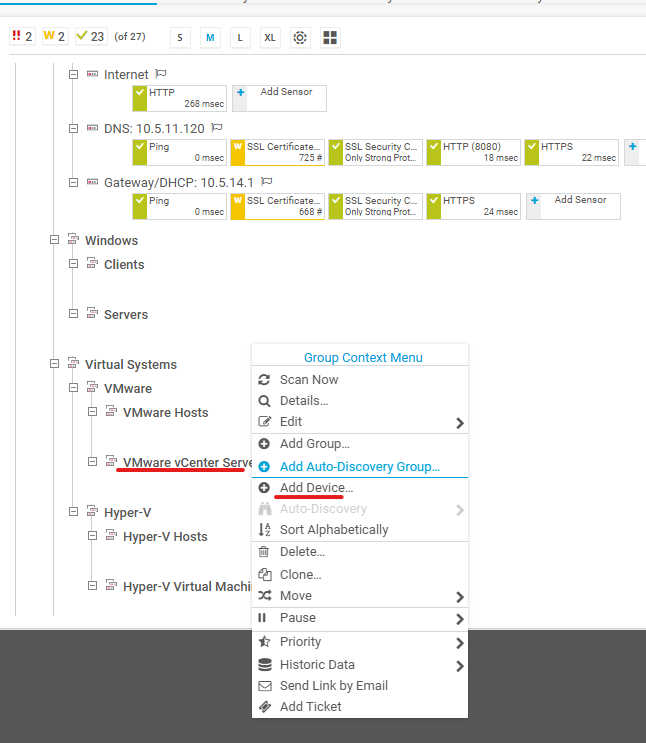
- Right click on a category and click ‘Add Device’
- Set the Device Name (displayname) and IP address/DNS name
- Set the Auto-Discovery Level to ‘Default auto-discovery’
- Untoggle the ‘inherit’ for whatever type of device you are adding
- Provide administrator credentials for the device
Add a Sensor
- Click ‘Add Sensor’ underneath the device you created
- Search for ‘Ping’
- Click ‘Pingv2’
- Leave the settings as default and click ‘Create’
PRTG natively provides a wide range of sensors, and you can use as many as you want for 30 days until you roll over to the free license, which is capped at 100. Some sensors to try out are things that monitor hardware (disk usage, CPU, etc.), Services (HTTPS, DNS), and applications (SQL queries, Veeam jobs).
